Outstanding Full-Year Execution Full-year 2013 production: 49.6 MMBoe, up 39% over 2012 (71% oil) 144,250 Boe per day in 4Q13: up 35% over 4Q12 Bakken: 93,330 Boe per day, up 38% over 4Q12 SCOOP: 23,750 Boe per day, up 233% over…
Theres Only One Bakken: Getting Bigger & Better Three Forks Thickness Map CLR leading basin-wide efforts to optimize oil recovery 1,320 Tangsrud* LTF 660 Lawrence** 2014 plan: 287 net wells (870 gross) Operating 22 average rigs…
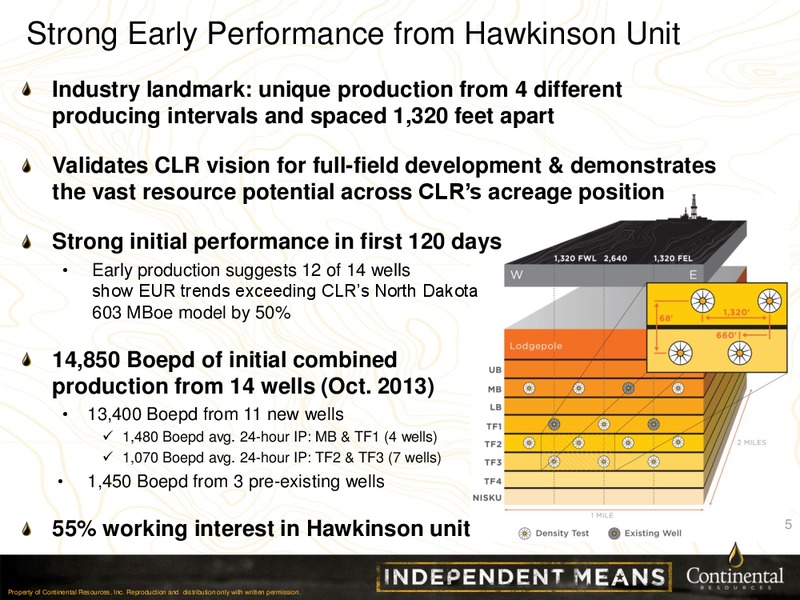
Strong Early Performance from Hawkinson Unit Industry landmark: unique production from 4 different producing intervals and spaced 1,320 feet apart Validates CLR vision for full-field development & demonstrates the vast resource…
Continental Goes Ears Back in Antelope Plan to drill 350-400 wells over the next five years utilizing mega-pads 50 wells budgeted for 2014, with large production impact in 2015 Full field development includes MB, TF1, TF2 and TF3…
CLR: The Premier Bakken Operator YE13 operated Bakken well costs were 8.0 million per well. Continental is targeting even lower YE14 well costs with a goal of 7.5 million per operated Bakken well for its typical completion design.…
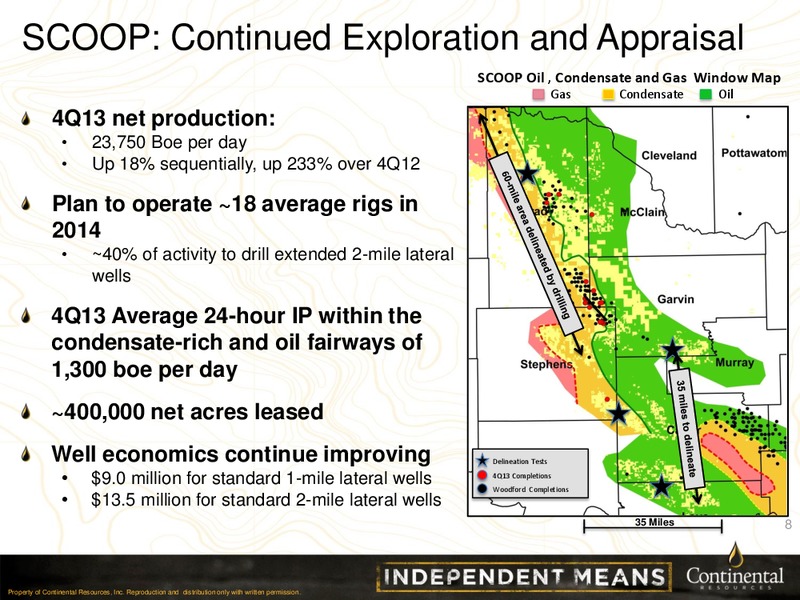
SCOOP: Continued Exploration and Appraisal SCOOP Oil , Condensate and Gas Window Map Gas Condensate Oil 4Q13 net production: 23,750 Boe per day Up 18% sequentially, up 233% over 4Q12 Plan to operate 18 average rigs in 2014 40%…
2014 Operational and Financial Guidance As of February 26, 2014* 2014 Production growth (YOY) 26% to 32% Capital expenditures (non-acquisition) 4.05B Operating Expenses: Production expense per Boe 5.60 to 6.10 Production tax…
EBITDAX Reconciliation to GAAP We use a variety of financial and operational measures to assess our performance. Among these measures is EBITDAX. EBITDAX represents earnings (net income) before interest expense, income taxes,…
EBITDAX Reconciliation to GAAP (contd) The following tables provide reconciliations of our net income and operating cash flows to EBITDAX for the periods presented: In thousands 2009 2010 2011 2012 4Q 2013 2013 Net income 71,338…
Adjusted Earnings Reconciliation to GAAP Our presentation of adjusted earnings and adjusted earnings per share that exclude the effect of certain items are non-GAAP financial measures. Adjusted earnings and adjusted earnings per share…
PV-10 Our PV-10 value, a non-GAAP financial measure, is derived from the Standardized Measure of discounted future net cash flows, which is the most directly comparable financial measure computed using U.S. GAAP. PV-10 generally differs…
 Loading...