4th Quarter and Full Year 2014 Financial Results Delivering our Transformation Plan All results are presented before Non-Recurring Charges & write-off, unless stated otherwise
2014 Highlights Deterioration in market conditions throughout the year Implementation and acceleration of Transformation Plan Downsizing of Marine fleet to 13 3D vessels completed Drastic restructuring of our Land and Airborne…
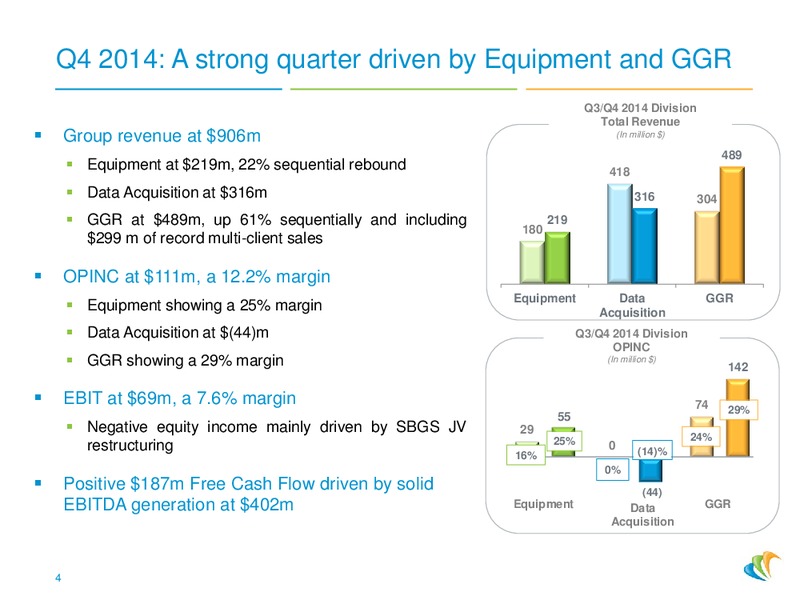
Q4 2014: A strong quarter driven by Equipment and GGR Q3/Q4 2014 Division Total Revenue Group revenue at 906m (In million ) 489 Equipment at 219m, 22% sequential rebound 418 Data Acquisition at 316m 316 304 GGR at 489m, up 61%…
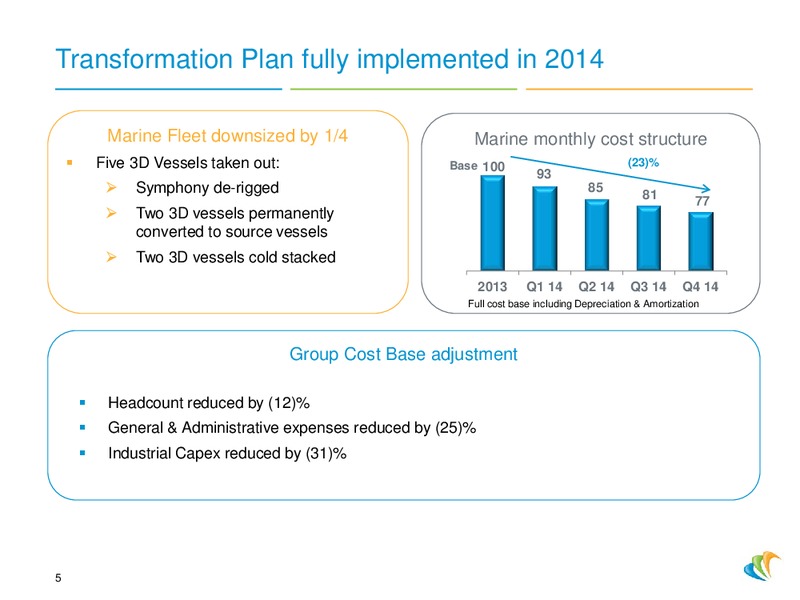
Transformation Plan fully implemented in 2014 Marine Fleet downsized by 1/4 Marine monthly cost structure Five 3D Vessels taken out: Base 100 (23)% 93 Symphony de-rigged 85 81 77 Two 3D vessels permanently converted to source…
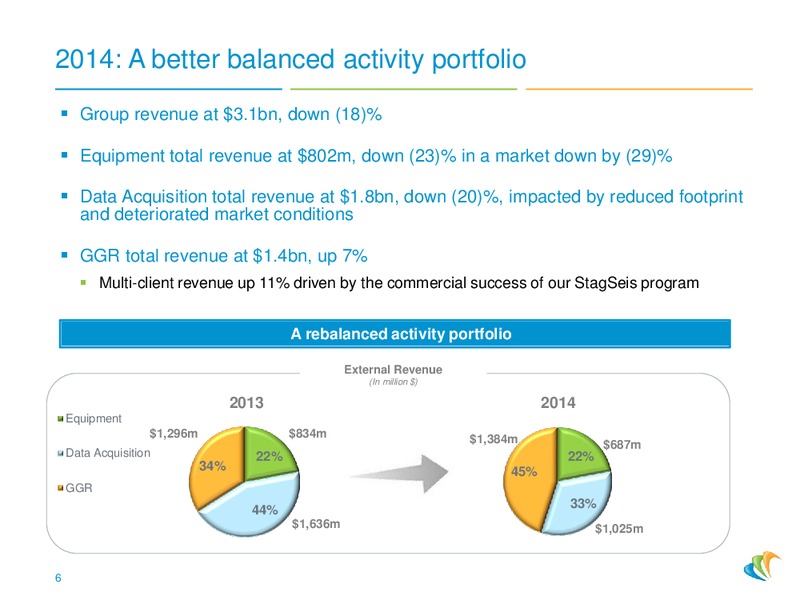
2014: A better balanced activity portfolio Group revenue at 3.1bn, down (18)% Equipment total revenue at 802m, down (23)% in a market down by (29)% Data Acquisition total revenue at 1.8bn, down (20)%, impacted by reduced footprint…
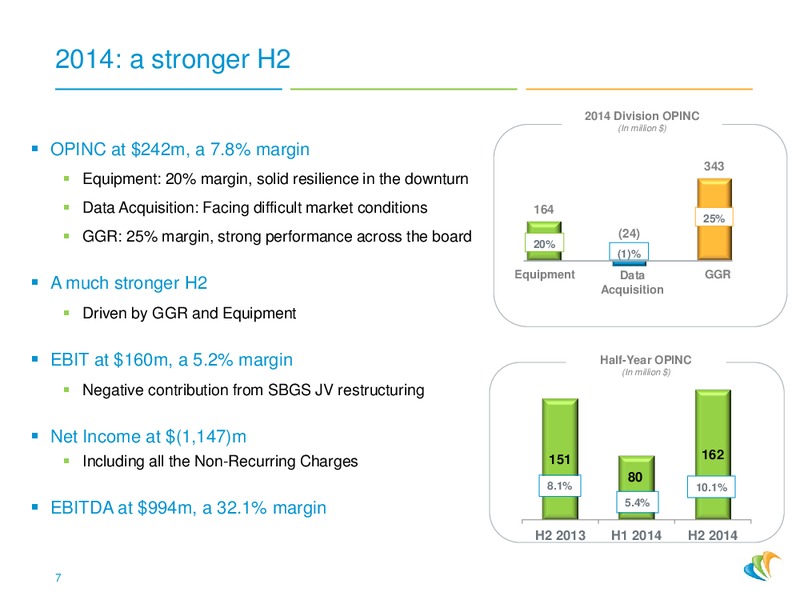
2014: a stronger H2 2014 Division OPINC (In million ) OPINC at 242m, a 7.8% margin 343 Equipment: 20% margin, solid resilience in the downturn Data Acquisition: Facing difficult market conditions 164 25% GGR: 25% margin, strong…
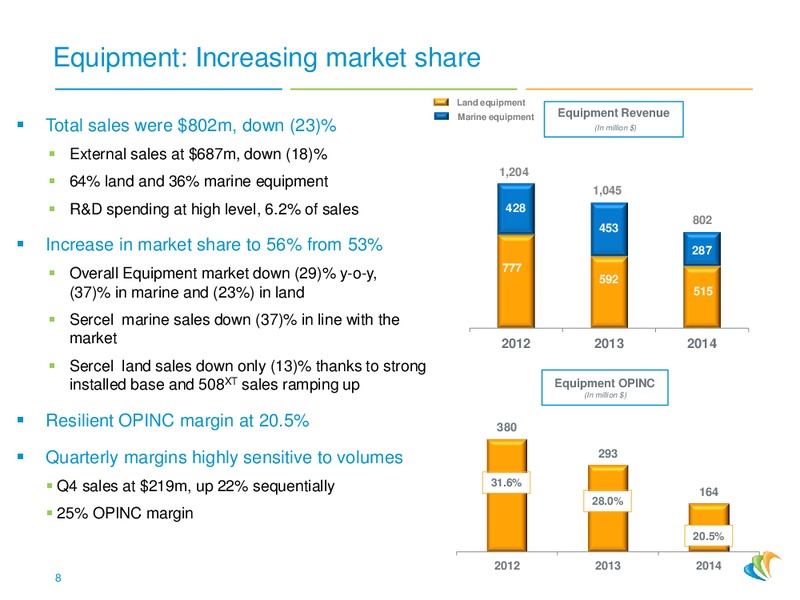
Equipment: Increasing market share Land equipment Marine equipment Equipment Revenue Total sales were 802m, down (23)% (In million ) External sales at 687m, down (18)% 1,204 64% land and 36% marine equipment 1,045 R&D spending…
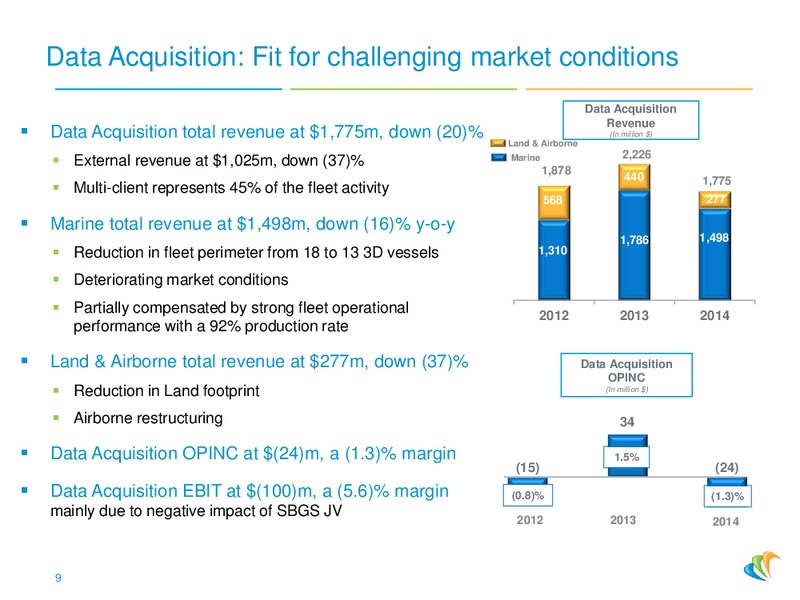
Data Acquisition: Fit for challenging market conditions Data Acquisition Revenue Data Acquisition total revenue at 1,775m, down (20)% Land & Airborne (In million ) 2,226 External revenue at 1,025m, down (37)% Marine 1,878 440…
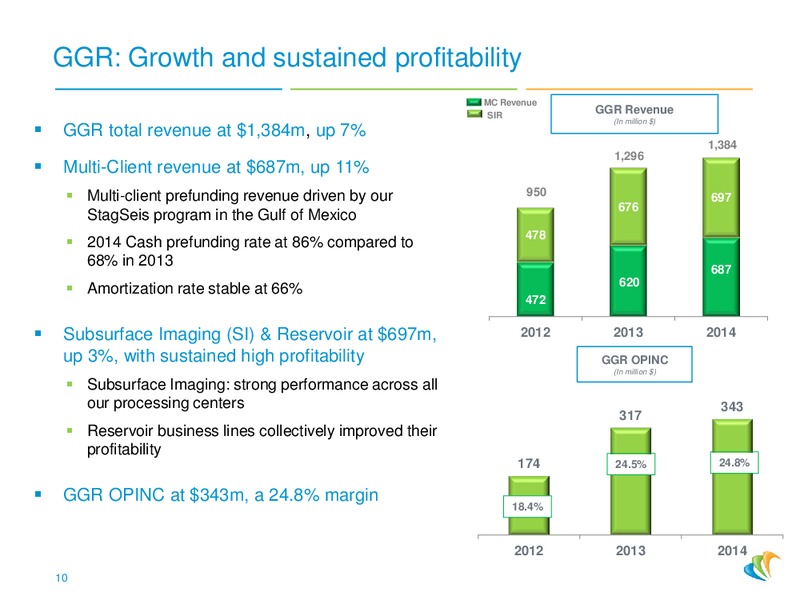
GGR: Growth and sustained profitability MC Revenue SIR GGR Revenue (In million ) GGR total revenue at 1,384m, up 7% 1,384 1,296 Multi-Client revenue at 687m, up 11% Multi-client prefunding revenue driven by our 950 697 676…
2014 Financial Review 11
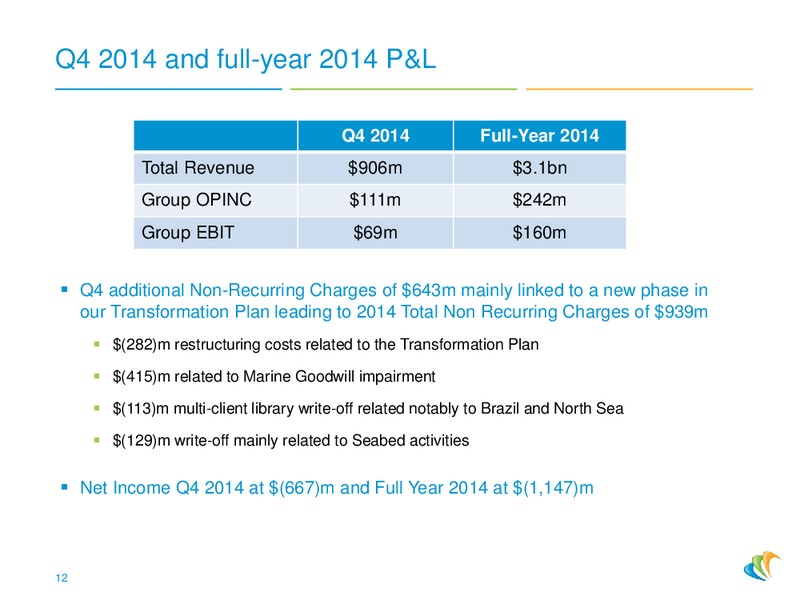
Q4 2014 and full-year 2014 P&L Q4 2014 Full-Year 2014 Total Revenue 906m 3.1bn Group OPINC 111m 242m Group EBIT 69m 160m Q4 additional Non-Recurring Charges of 643m mainly linked to a new phase in our Transformation Plan leading…
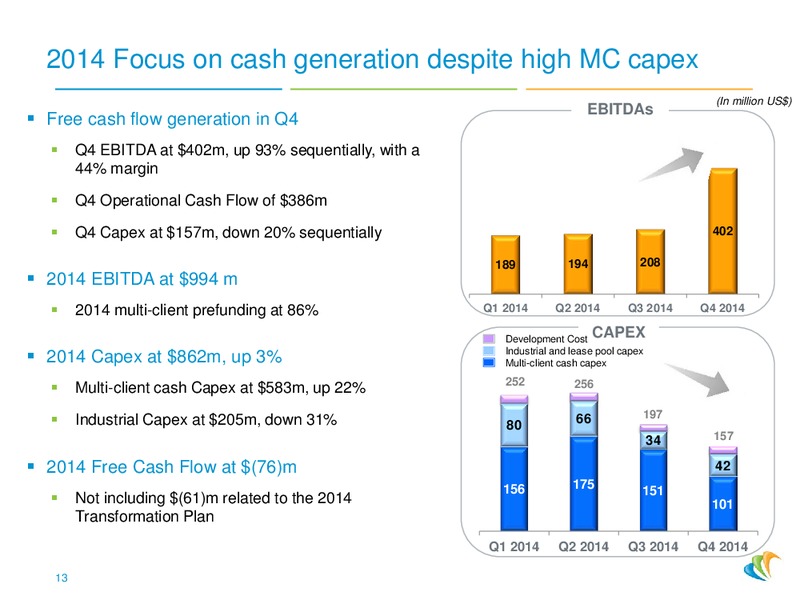
2014 Focus on cash generation despite high MC capex (In million US) EBITDAs Free cash flow generation in Q4 Q4 EBITDA at 402m, up 93% sequentially, with a 44% margin Q4 Operational Cash Flow of 386m Q4 Capex at 157m, down 20%…
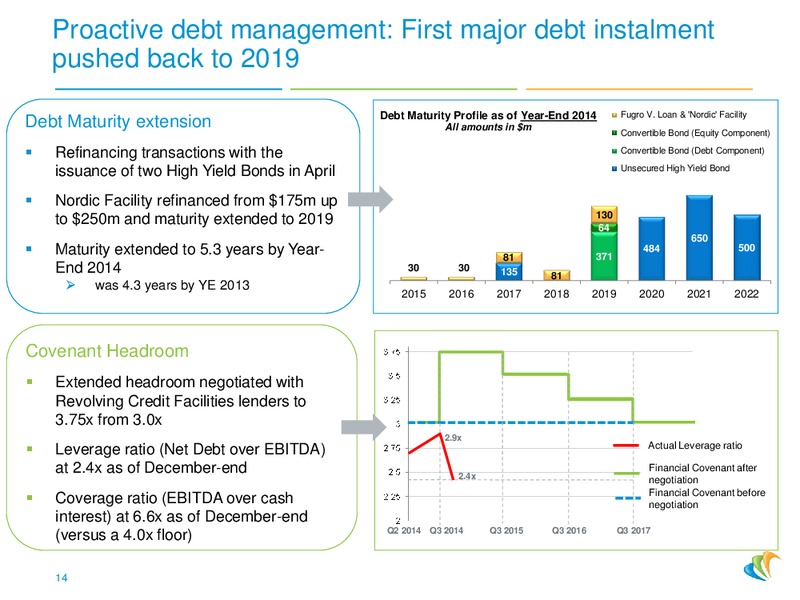
Proactive debt management: First major debt instalment pushed back to 2019 Debt Maturity Profile as of Year-End 2014 Fugro V. Loan & 'Nordic' Facility Debt Maturity extension All amounts in m Convertible Bond (Equity Component)…
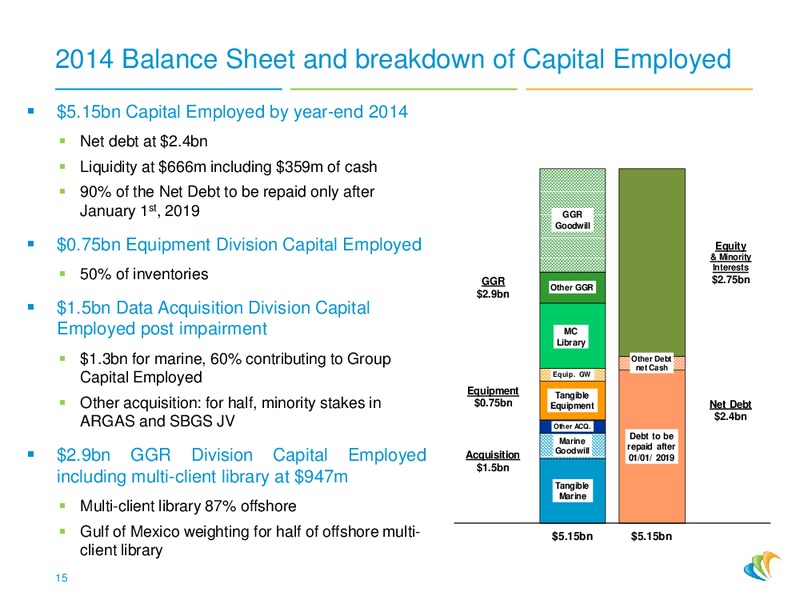
2014 Balance Sheet and breakdown of Capital Employed 5.15bn Capital Employed by year-end 2014 Net debt at 2.4bn Liquidity at 666m including 359m of cash 90% of the Net Debt to be repaid only after January 1st, 2019 GGR Goodwill…
Outlook
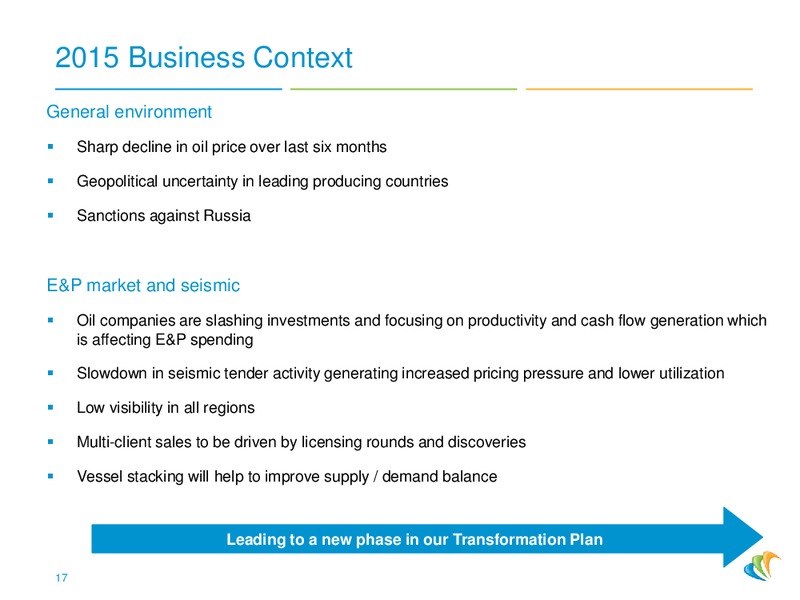
2015 Business Context General environment Sharp decline in oil price over last six months Geopolitical uncertainty in leading producing countries Sanctions against Russia E&P market and seismic Oil companies are slashing…
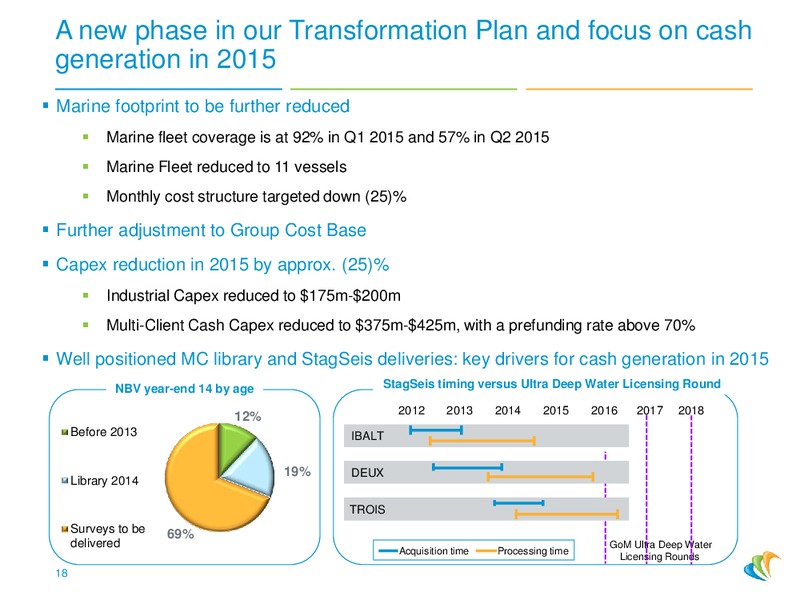
A new phase in our Transformation Plan and focus on cash generation in 2015 Marine footprint to be further reduced Marine fleet coverage is at 92% in Q1 2015 and 57% in Q2 2015 Marine Fleet reduced to 11 vessels Monthly cost…
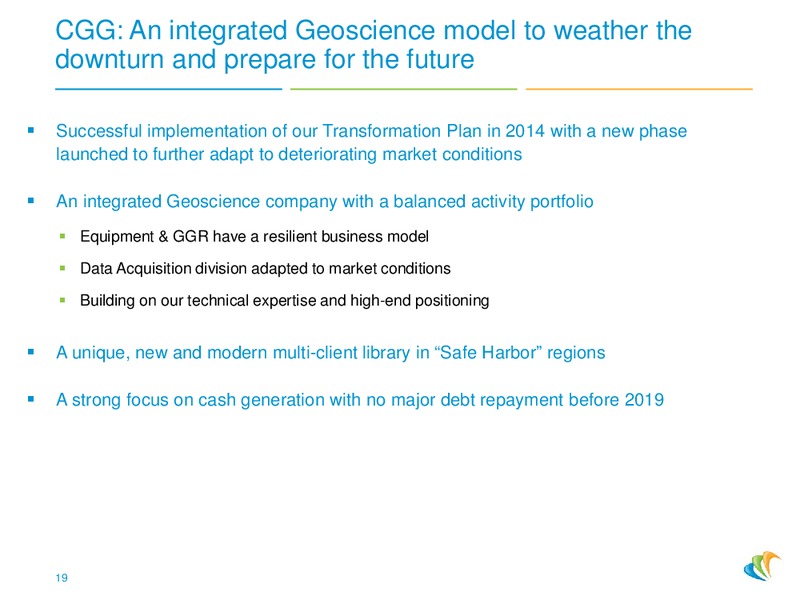
CGG: An integrated Geoscience model to weather the downturn and prepare for the future Successful implementation of our Transformation Plan in 2014 with a new phase launched to further adapt to deteriorating market conditions An…
Thank you
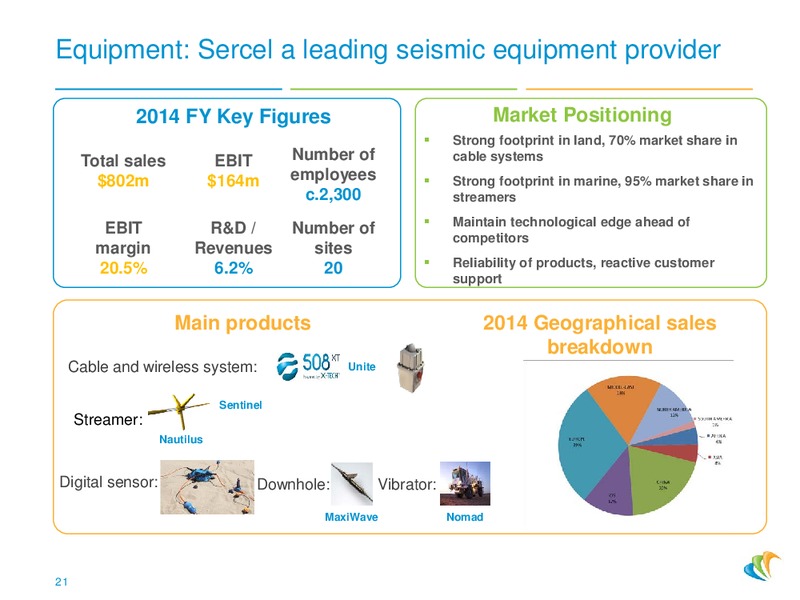
Equipment: Sercel a leading seismic equipment provider 2014 FY Key Figures Market Positioning Strong footprint in land, 70% market share in Total sales EBIT Number of cable systems 802m 164m employees Strong footprint in marine, 95%…
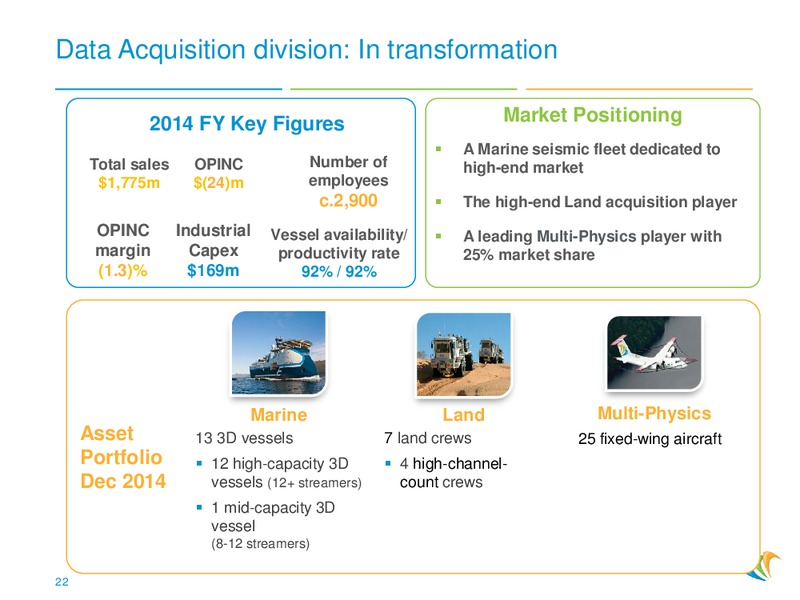
Data Acquisition division: In transformation 2014 FY Key Figures Market Positioning A Marine seismic fleet dedicated to Total sales OPINC Number of high-end market 1,775m (24)m employees c.2,900 The high-end Land acquisition player…
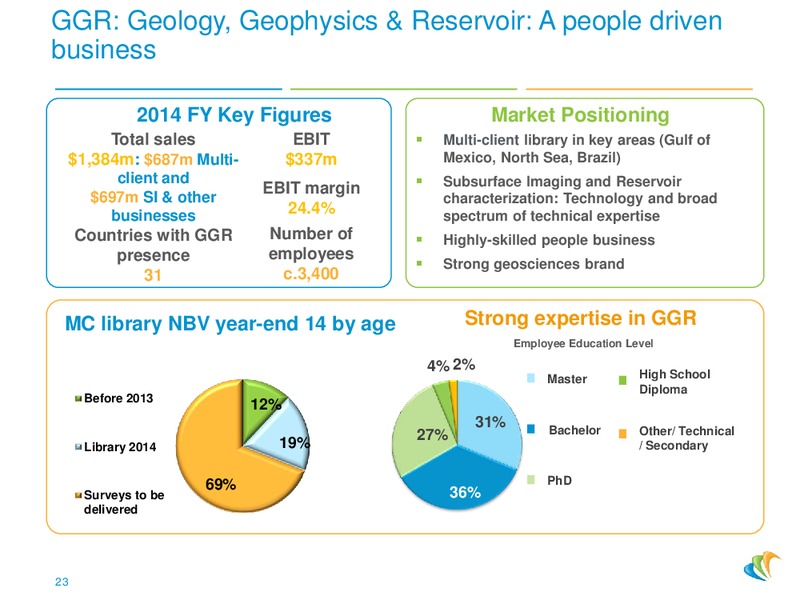
GGR: Geology, Geophysics & Reservoir: A people driven business 2014 FY Key Figures Market Positioning Total sales EBIT Multi-client library in key areas (Gulf of 1,384m: 687m Multi- 337m Mexico, North Sea, Brazil) client and…
 Loading...