150 years 150 years We add value as one company Hartwig Michels President Region Europe Nomura Global Chemical Industry Leaders Conference London March 26, 2015 BASF Capital Market Story March 2015 1
150 years We create chemistry for a sustainable future Positioning Performance Perspective Ludwigshafen, 90 Germany Nanjing, 80 Antwerp, China 70 Belgium 60 Kuantan, 50 Geismar, Malaysia 40 USA Freeport, 30 USA 20 2008…
150 years BASF today a well-balanced portfolio Total sales 2014: 74 billion Percentage of sales 2014* * Not depicted here: 5% of Group sales reported as Other. Paper Chemicals results have been incl. in Performance Products until…
150 years Strategy Our purpose Sustainability is an integral part of our strategy BASF Capital Market Story March 2015 5
150 years Verbund: Unique competitive advantage Verbund generates 1 billion p.a. global cost savings* & supports sustainability Example Ludwigshafen site: Shared use of on-site facilities: Global reduction in carbon avoidance…
Business review Growth levers BASF Capital Market Story March 2015 7
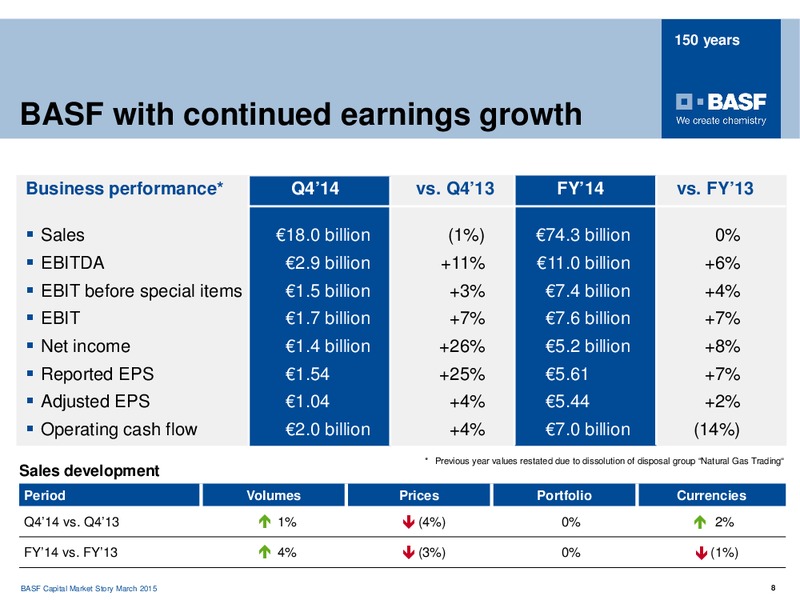
150 years BASF with continued earnings growth Business performance* Q414 vs. Q413 FY14 vs. FY13 Sales 18.0 billion (1%) 74.3 billion 0% EBITDA 2.9 billion +11% 11.0 billion +6% EBIT before special items 1.5 billion +3% 7.4…
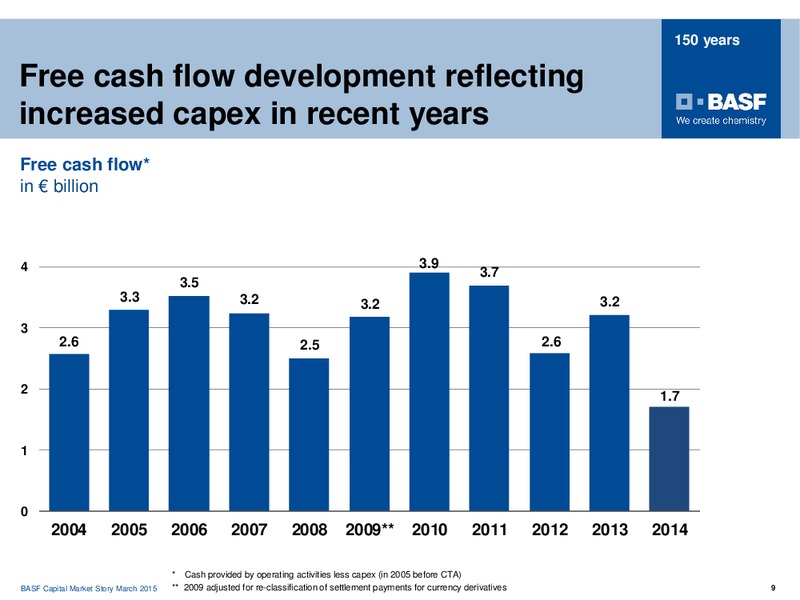
150 years Free cash flow development reflecting increased capex in recent years Free cash flow* in billion 4 3.9 3.7 3.5 3.3 3.2 3.2 3.2 3 2.6 2.5 2.6 2 1.7 1 0 2004 2005 2006 2007 2008 2009** 2010 2011 2012 2013 2014…
150 years Attractive shareholder return Dividend per share () Dividend policy We want to grow or at least Proposal: maintain our dividend 3,0 3.00 2.70 2.80 2.50 2.60 2,5 2.50 2.20 Key facts 1.95 1.95 2,0 2.00 1.70…
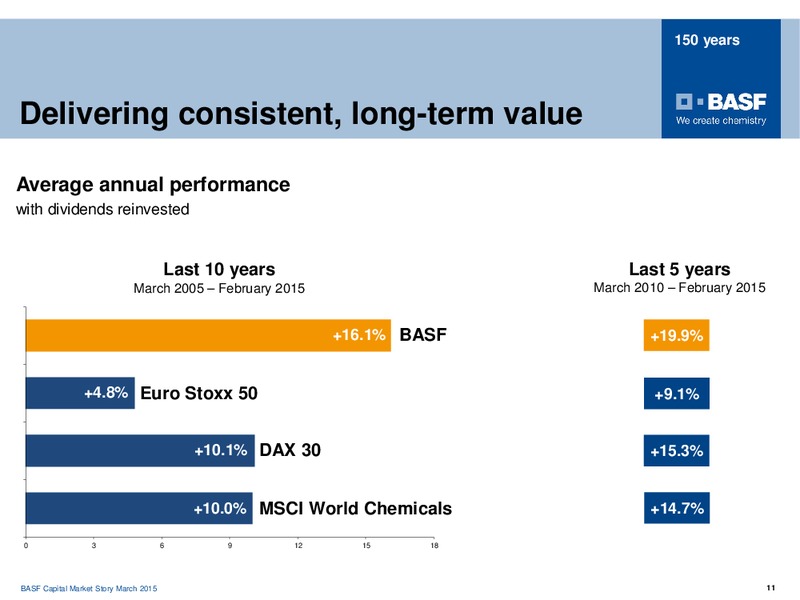
150 years Delivering consistent, long-term value Average annual performance with dividends reinvested Last 10 years Last 5 years March 2005 February 2015 March 2010 February 2015 +16.1% BASF +19.9% +4.8% Euro Stoxx 50…
150 years Outlook 2015 Expectations for the global economy Forecast 2015 2014 (actual) GDP 2.8% 2.5% Chemicals (excl. pharma) 4.2% 4.0% Industrial production 3.6% 3.4% US / Euro 1.20 1.33 Oil price: Brent (US / bbl) 60-70 99…
150 years Outlook BASF Group 2015 We aim to increase volumes and sales excluding the effects of acquisitions and divestitures. Sales are likely to be slightly higher than in 2014, driven by higher sales in the Performance…
150 years Oil & Gas: Impact of the current oil price and measures Production split* 2014 Key Facts Liquids 25% Western European gas prices Natural Gas predominantly market-driven 136 75% Gas markets outside of Europe million…
150 years Outlook 2015-Forecast by segment EBIT before special items Million 2014 Forecast 2015 Chemicals 2,367 slight decrease Performance Products 1,455 considerable increase Functional Materials & Solutions 1,197…
Business review Growth levers Portfolio development Market approach Innovations for a sustainable future Acquisitions Investments Operational excellence BASF Capital Market Story March 2015 16
150 years Portfolio development Moving downstream towards customer industries Functionalized Materials Classical Chemicals Customized Products & Solutions Chemical Industry First customer industries* 2001 in % of 50% 50%…
150 years Portfolio development Towards more market driven and innovative businesses Acquisitions BASF Divestitures core business Catalysts Agro generics Selected transactions Construction chemicals 2005 today Vitamin premixes…
150 years Market approach Cross-divisional customer industry approach BASF sales by Bubble Size: BASF divisional sales by first customer industry*/** first customer industry* Consumer goods 15 % Transportation 15 %…
150 years Strong commitment to innovation Innovations for a sustainable future R&D expenditures Key facts ( billion) Further increase of R&D spending in 2015 2.0 2,0 1.8 1.9 Corporate Research 10,700 employees in R&D 1.7 21% 1.6…
150 years Innovation: Four-Way Conversion Catalyst (FWC) FWC reduces emission of gaseous pollutants and particulates FWC HC Combines functionality of a 3-way CO conversion catalyst with NOx integrated filter on a ceramic…
150 years Innovation: Green Sense Concrete for sustainable construction BASFs Green Sense Concrete system consists of: 1) Innovative admixture products Low 2) Concrete mix services 3) Eco-efficiency analysis Environmental…
150 years Innovation: Trilon M Chelating agent for more sustainable detergents and cleaners Trilon M Alternative to phosphate for automatic dish washing High sustainability performance: Bio-degradable and eco-friendly Fast growing…
150 years Innovation: SAVIVA Highly efficient Superabsorbent Polymers (SAP) SAVIVA Based on a pioneering SAP technology platform SAVIVA the next generation of SAP Round-shaped particles with micro-pores initiates innovative liquid…
150 years Innovation: New acrylic acid technology BASF with best-in-class acrylic acid process Acrylic acid production technology benchmark Key facts Industry average costs = 100; normalized Lower production cost than industry…
150 years Growth fields for innovation Key customer industries Growth fields Technology fields Batteries for Mobility Enzymes Materials, Transportation Agriculture E-Power Management Systems & Nanotechnology Functional Crop…
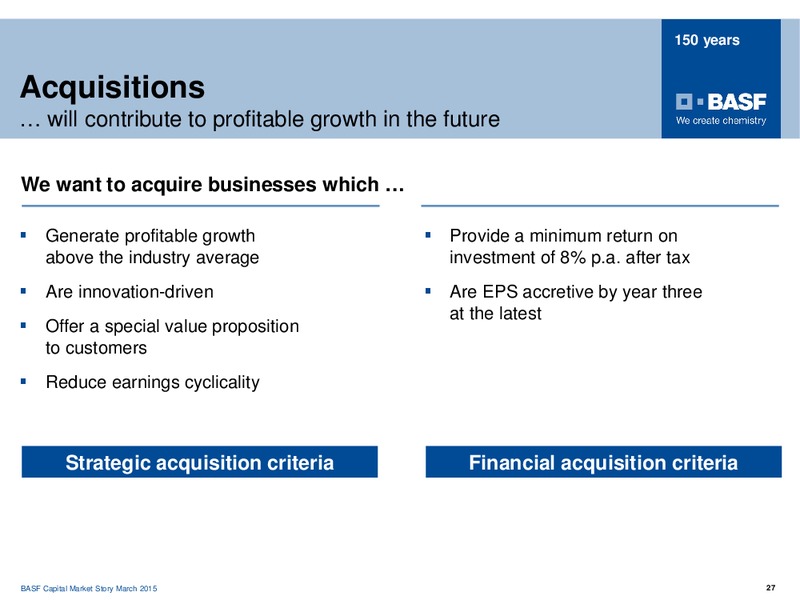
150 years Acquisitions will contribute to profitable growth in the future We want to acquire businesses which Generate profitable growth Provide a minimum return on above the industry average investment of 8% p.a. after tax Are…
150 years Major investment project start-ups in 2015 Major capex projects for start-up in 2015 Nanjing Ludwigshafen Neopentylglycol TDI complex +40,000 mt Theodore +300,000 mt Specialty amines* Chelating agents* Specialty amines*…
150 years Investments for organic growth Capex budget 2015-2019 Capex budget 2015-2019 by segment by region Performance Products Asia Pacific 15% 18% South Europe Functional Chemicals America* 45% Materials & 33% 19.5 8% 19.5…
150 years Operational excellence programs 1.3 billion earnings contribution by 2015 Annual earnings contribution STEP program in million Targeted annual earnings contribution increased 4,000 from 1 billion to 1.3 billion by end of…
150 years Restructuring measures in Performance Products strengthening competitiveness Reduction of 2,400 positions until end of 2017 Annual earnings contribution of 500 million from 2017 onwards Run rate of 250 million by end…
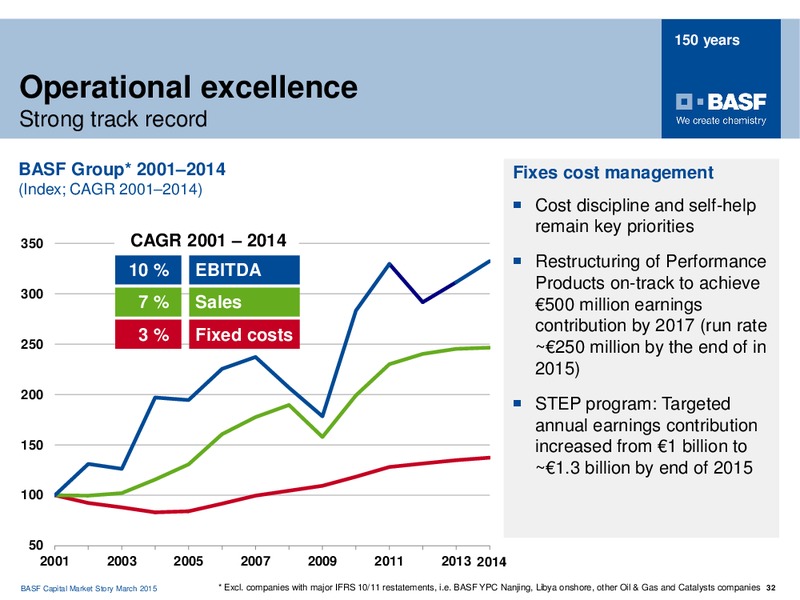
150 years Operational excellence Strong track record BASF Group* 20012014 Fixes cost management (Index; CAGR 20012014) Cost discipline and self-help remain key priorities 350 CAGR 2001 2014 10 % EBITDA Restructuring of Performance…
150 years BASF is the 1 chemical company has a strong track record of profitable growth relentlessly focuses on Operational Excellence targets promising growth opportunities is committed to delivering high shareholder returns…
Appendix I Q 4 2014 results BASF Capital Market Story March 2015 34
150 years Chemicals Petrochemicals drive earnings growth Q414 segment sales (million ) vs. Q413 EBIT before special items (million ) 580 2,367 600 2,500 Intermediates Petrochemicals 510 2,182 686 1,803 2,000 (3%) (10%) 400 4,071…
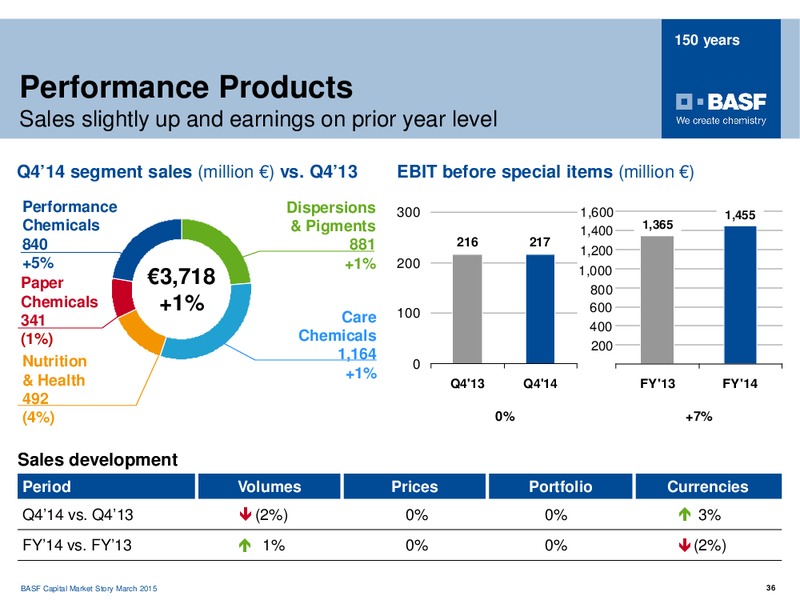
150 years Performance Products Sales slightly up and earnings on prior year level Q414 segment sales (million ) vs. Q413 EBIT before special items (million ) Performance Dispersions 300 1,600 1,455 Chemicals & Pigments 1,400 1,365 840…
150 years Functional Materials & Solutions Continued robust demand from automotive Q414 segment sales (million ) vs. Q413 EBIT before special items (million ) 250 238 1,200 1,197 220 1,070 Performance Catalysts 1,000 Materials…
150 years Agricultural Solutions Strong finish to the year Q414 segment sales (million ) vs. Q413 EBIT before special items (million ) 1,109 1,000 890 140 1,400 123 1,222 120 1,200 1,109 800 100 1,000 600 80 800 67 400 60 600…
150 years Oil & Gas Lower oil and gas prices impacted earnings Q414 segment sales (million ) vs. Q413 EBIT before special items / Net income (million )* Natural Gas Exploration & Trading Production 800 2,000 1,856 1,795 3,277 728…
150 years Review of Other Million Q4 2014 Q4 2013 2014 2013 Sales 700 1,106 3,609 4,190 EBIT before special items (28) (114) (566) (618) Thereof corporate research costs (98) (102) (389) (386) group corporate costs (59) (66)…
150 years Operating cash flow development in 2014 Million 2014 2013* Cash provided by operating activities 6,958 8,100 Thereof changes in net working capital (699) 714 miscellaneous items (953) (720) Cash provided by investing…
150 years Balance sheet remains strong Balance sheet 2014 vs. 2013 Highlights 2014 (billion ) Increase in long-term assets 71.4 71.4 by 5.7 billion, due to capex 64.2 64.2 and acquisitions Increase of pension provisions…
150 years BASF Europe Setting course for higher growth
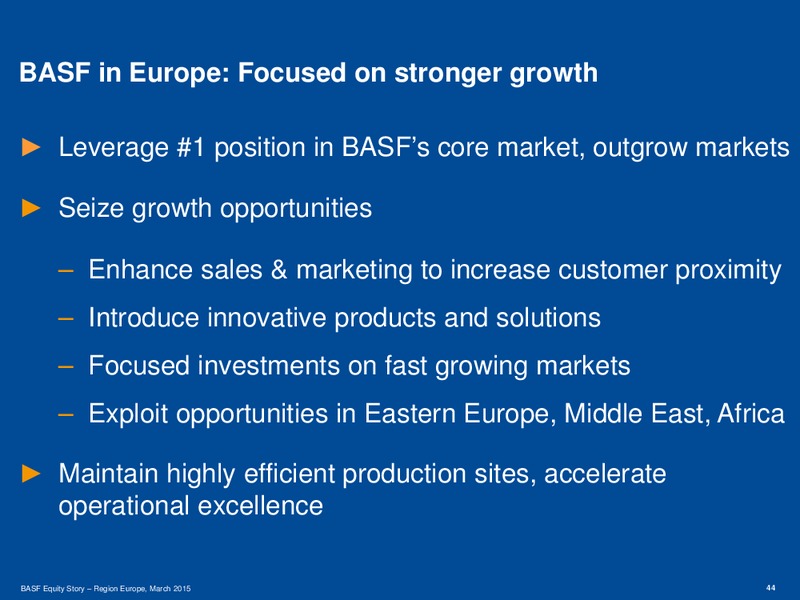
BASF in Europe: Focused on stronger growth Leverage 1 position in BASFs core market, outgrow markets Seize growth opportunities Enhance sales & marketing to increase customer proximity Introduce innovative products and solutions…
Business environment in Europe BASF in Region Europe Growth at different speeds BASF Equity Story Region Europe, March 2015 45
150 years Europe is a significant and growing chemicals market Chemical production (excl. pharma) in Europe Macroeconomic Situation (billion US) Population of 2 bn people +1.6% p.a. GDP and industrial production growth of 2%…
150 years Development of key customer industries* in Europe Agricultural Solutions Long-term fundamentals remain strong Growth above chemical market Construction Strong markets in Turkey and Saudi Arabia Growing confidence in…
Business environment in Europe BASF in Region Europe Growth at different speeds BASF Equity Story Region Europe, March 2015 48
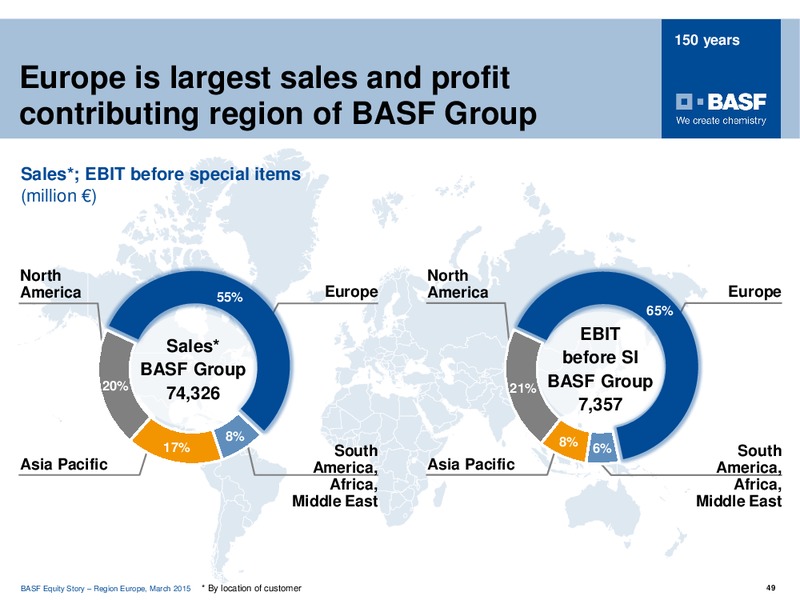
150 years Europe is largest sales and profit contributing region of BASF Group Sales*; EBIT before special items (million ) North North America 55% Europe America Europe 65% EBIT Sales* before SI BASF Group 20% 21% BASF Group…
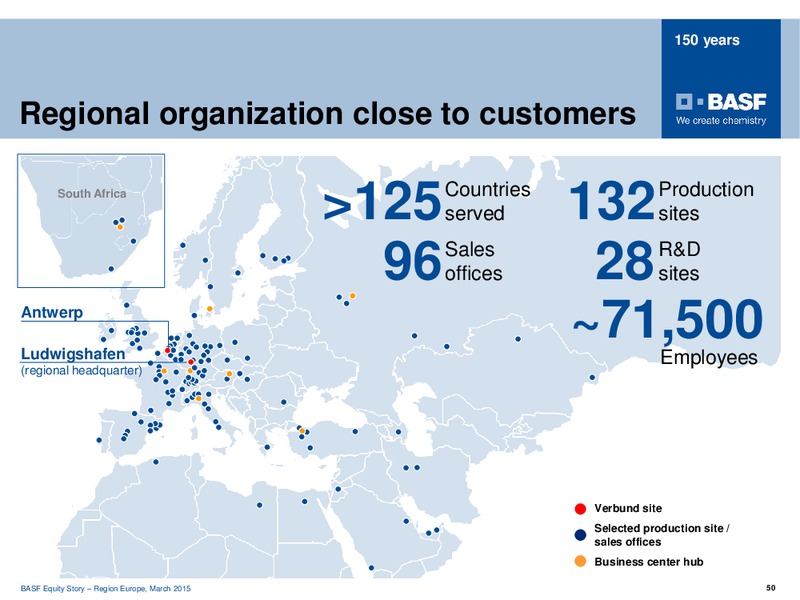
150 years Regional organization close to customers South Africa 125 Countries served 132 Production sites 96 Sales offices 28 R&D sites Antwerp Ludwigshafen 71,500 Employees (regional headquarter) Verbund site…
Business environment in Europe BASF in Region Europe Growth at different speeds Western Europe Central Europe Emerging Europe BASF Equity Story Region Europe, March 2015 51
150 years Stable business in past years, focus in the future on accelerated organic growth Sales development chemicals business and crop Structural Excellence Program protection in Europe Europe Accelerate organic (billion ) business…
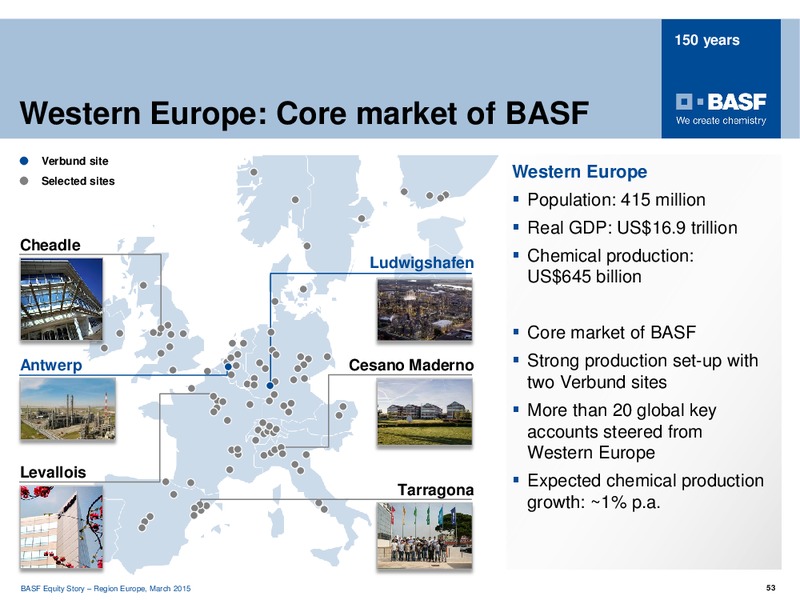
150 years Western Europe: Core market of BASF Verbund site Selected sites Western Europe Population: 415 million Real GDP: US16.9 trillion Cheadle Ludwigshafen Chemical production: US645 billion Core market of BASF Antwerp…
150 years Western Europe: Accelerate profitable growth Western Europe BASF VC investment in New precious metals Accelerate profitable growth SmartKem recycling plant in Cinderford Stronger local presence Deeper customer…
150 years Central Europe: Attractive market next door Central Europe Bratislava Warsaw Population: 105 million Real GDP: US1.4 trillion Chemical production: US44 billion Ljubljana Belgrade Economies in transition from emerging…
150 years Central Europe: Participate in local growth opportunities Mobile Catalysts Production Central Europe in Sroda Slaska Continuously expand market position Construction systems in Being close to our customers Czech…
150 years Emerging Markets: Turkey & Middle East Focus on locally consuming industries Gebze Turkey & Middle East Population: 268 million Real GDP: US2.9 trillion Chemical production: Istanbul US120 billion Growth drivers:…
150 years Emerging Markets: Turkey & Middle East Focus on locally consuming industries Nutrition lab in Istanbul Turkey & Middle East Regional hubs: Istanbul, Dubai Sustainable 3000 customers construction Accelerated market…
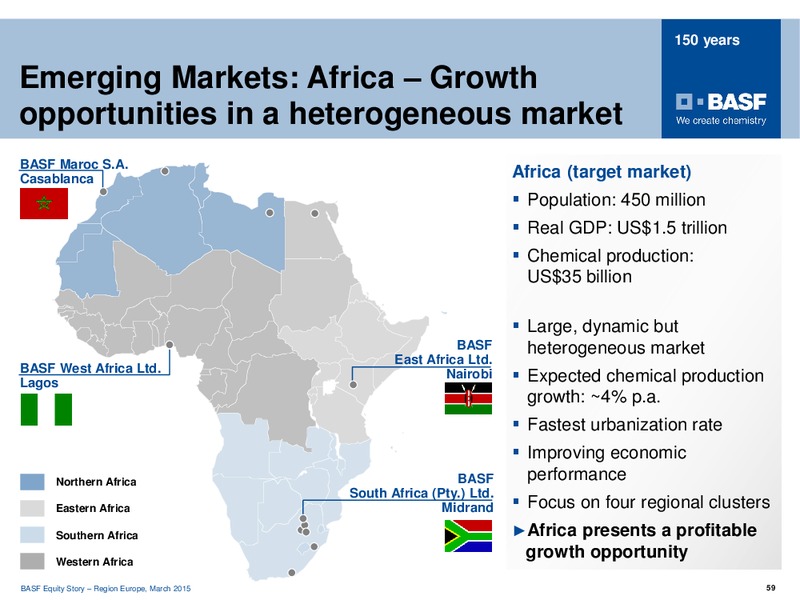
150 years Emerging Markets: Africa Growth opportunities in a heterogeneous market BASF Maroc S.A. Casablanca Africa (target market) Population: 450 million Real GDP: US1.5 trillion Chemical production: US35 billion Large, dynamic…
150 years Emerging Markets: Africa Growth opportunities in a heterogeneous market Setup to capture growth opportunities: Business focused on Construction Construction chemicals Chemicals in Kenya Crop protection products…
BASF in Europe: Focused on stronger growth Leverage 1 position in BASFs core market, outgrow markets Seize growth opportunities Enhance sales & marketing to increase customer proximity Introduce innovative products and solutions…
150 years BASF Equity Story Region Europe, March 2015 62
 Loading...