Simplifying Our Portfolio, Advancing Our Highest-Return Assets Refocused and Marcellus high-graded portfolio Enhancing our core positions, scale to compete Oklahoma City Headquarters High rates of return driving Haynesville…
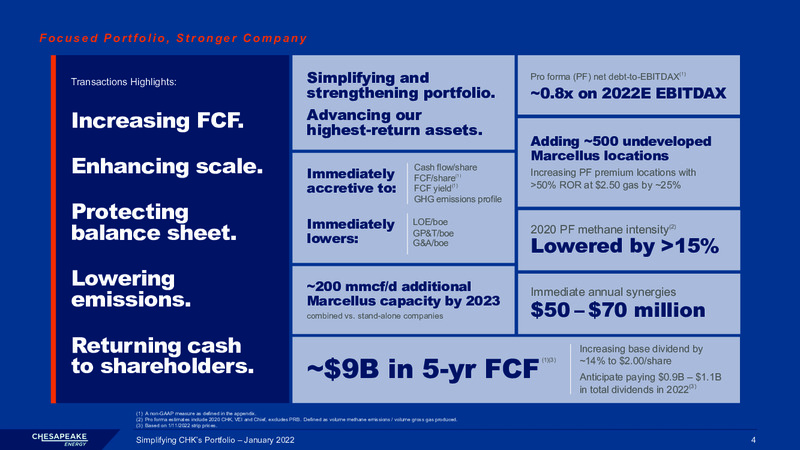
Focused Portfolio, Stronger Company Transactions Highlights: Simplifying and Pro forma (PF) net debt-to-EBITDAX(1) strengthening portfolio. 0.8x on 2022E EBITDAX Advancing our Increasing FCF. highest-return assets. Adding 500…
Building the Premier Marcellus Position Marcellus Shale 2022E 2022E 2022E Annualized CHK(1) CHK PF(1) Chief (1) Net Acres 540,000 113,000 653,000 Held by Production 96% 94% 95% Average Working Interest 40% 65% 50% Gross…
Increasing Total Capacity and Out-of-Basin Exposure 200 mmcf/d additional Marcellus capacity by 2023 combined vs. stand-alone companies Grows out-of-basin exposure from 30% to 45% Atlantic Sunrise and Leidy Southeast capacity…
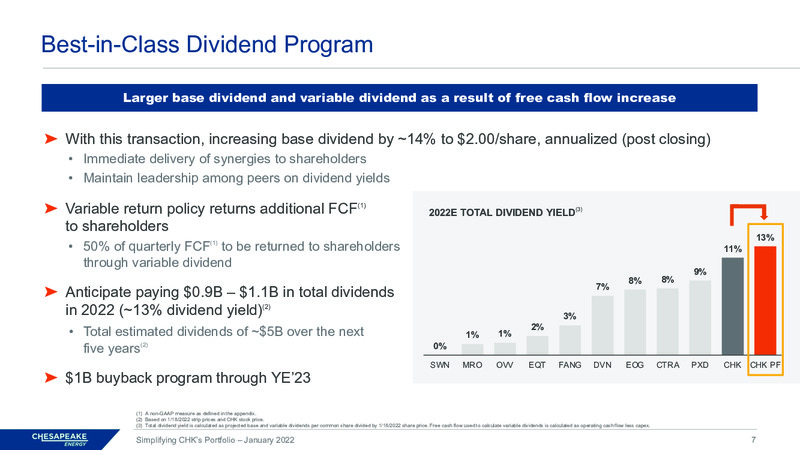
Best-in-Class Dividend Program Larger base dividend and variable dividend as a result of free cash flow increase With this transaction, increasing base dividend by 14% to 2.00/share, annualized (post closing) Immediate delivery of…
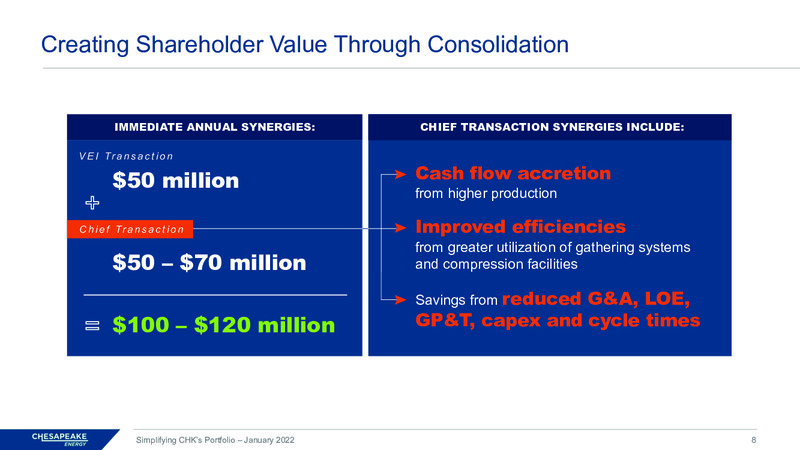
Creating Shareholder Value Through Consolidation IMMEDIATE ANNUAL SYNERGIES: CHIEF TRANSACTION SYNERGIES INCLUDE: V E I Tr a n s a c t i o n 50 million Cash flow accretion from higher production C h i e f Tr a n s a c t i o n…
Enhanced Pro Forma GHG Emissions Profile 2020 PF GHG intensity(1) 4.9 kg CO2e/boe Haynesville 2020 CHK: 6.0 kg CO2e/gross boe production RSG certified at YE21 Legacy Marcellus 100% 2020 PF methane intensity(1)(2) 0.09%…
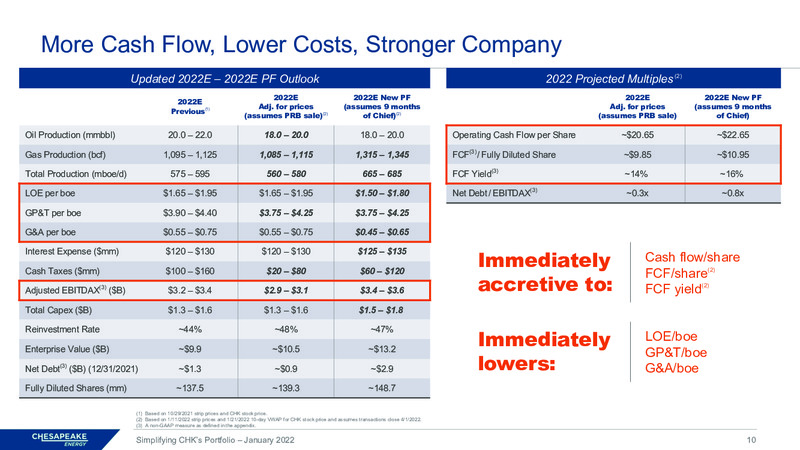
More Cash Flow, Lower Costs, Stronger Company Updated 2022E 2022E PF Outlook 2022 Projected Multiples (2) 2022E 2022E New PF 2022E 2022E New PF 2022E Adj. for prices (assumes 9 months Adj. for prices (assumes 9 months Previous(1)…
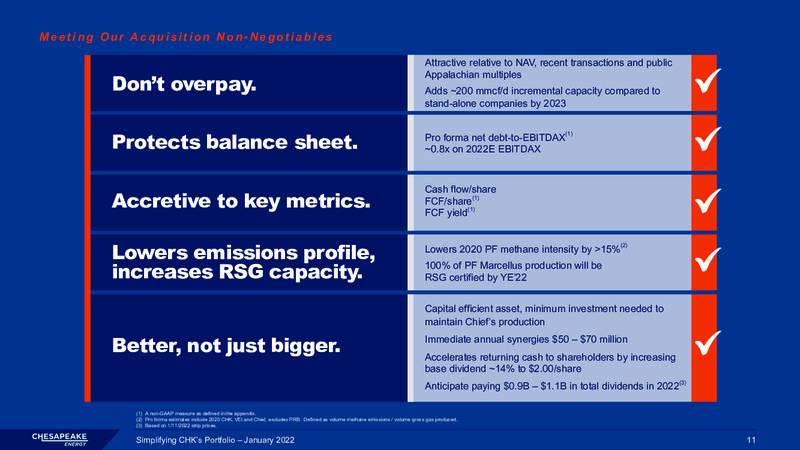
Meeting Our Acquisition Non-Negotiables Attractive relative to NAV, recent transactions and public Dont overpay. Appalachian multiples Adds 200 mmcf/d incremental capacity compared to stand-alone companies by 2023 Protects…
Value Drivers ACQUISITION OF CHIEF + DIVESTITURE OF PRB Simplifying portfolio to highest-return assets Strengthens Marcellus position Accretive to free cash flow and dividend yield Leverages in-basin experience, knowledge and…
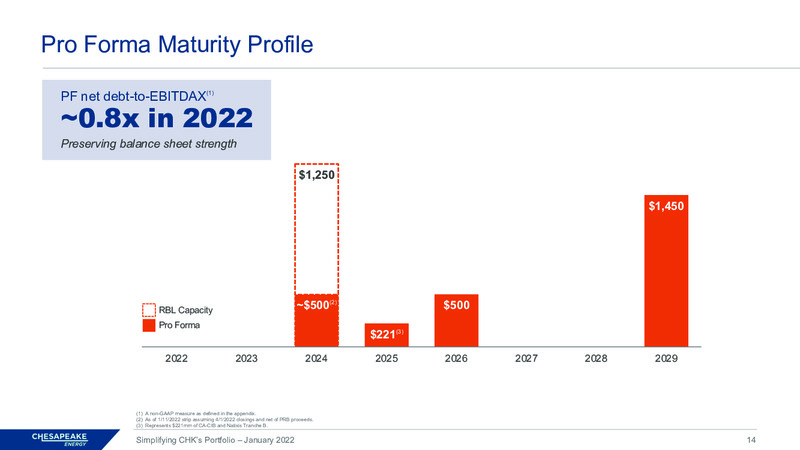
Pro Forma Maturity Profile PF net debt-to-EBITDAX(1) 0.8x in 2022 Preserving balance sheet strength 1,250 1,450 RBL Capacity 500(2) 500 Pro Forma 221(3) 2022 2023 2024 2025 2026 2027 2028 2029 (1) A non-GAAP measure…
Non-GAAP Financial Measures This document includes non-GAAP financial measures. Such non-GAAP measures should not be considered as an alternative to, or more meaningful than, GAAP measures. The Companys management believes that these…
 Loading...