

Economics : Type Curve
Showing 3 Results
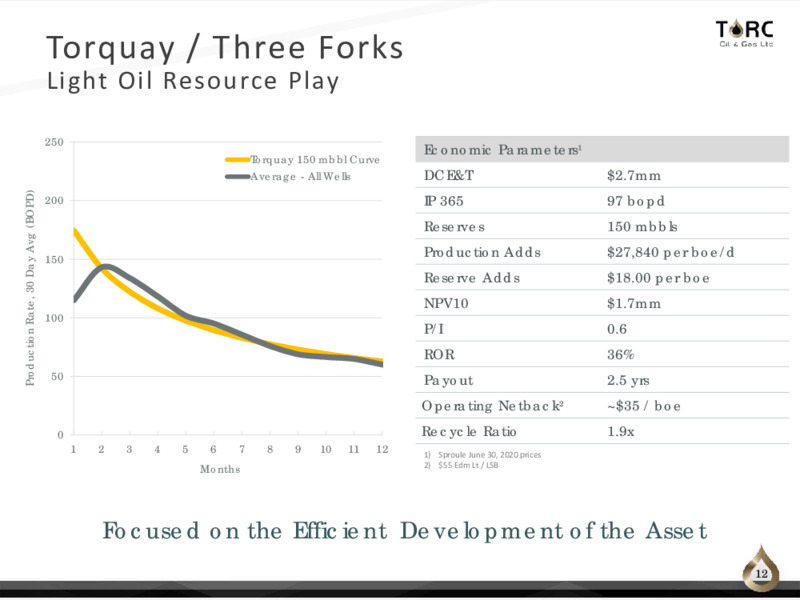
Torquay / Three Forks
Light Oil Resource Play
250
Economic Parameters1
Torquay 150 mbbl Curve
Average - All Wells DCE&T 2.7mm
Production Rate, 30 Day Avg (BOPD)
200 IP 365 97 bopd
Reserves 150 mbbls
150
Production Adds 27,840 per boe/d
Reserve Adds 18.00 per boe
NPV10 1.7mm
100
P/I 0.6
ROR 36%
50 Payout 2.5 yrs
Operating Netback2 35 / boe
0 Recycle Ratio 1.9x
1 2 3 4 5 6 7 8 9 10 11 12 1) Sproule June 30, 2020 prices
2) 55 Edm Lt / LSB
Months
Focused on the Efficient Development of the Asset
12
TORC Oil & Gas Ltd.
December 2020

FRAC MIDALE / OPEN HOLE FROBISHER
FRAC MIDALE WELL PERFORMANCE OPEN HOLE FROBISHER WELL PERFORMANCE
400 400
Frac Midale Type Curve Open Hole Frobisher Type Curve
300 300
BBL/D
BBL/D
200 200
100 100
0 0
1 2 3 4 5 6 7 8 9 10 11 12 1 2 3 4 5 6 7 8 9 10 11 12
MONTH ON PRODUCTION MONTHS ON PRODUCTION
FRAC MIDALE Expected gross per well economics OPEN HOLE FROBISHER Expected gross per well economics
DCET Well Cost ( million) 1.7 DCET Well Cost ( million) 0.9
IP30 Rate (boe/d)** 153 IP30 Rate (boe/d)** 110
EUR per well (mboe)** 125 EUR per well (mboe)** 53
After Tax ROR (%) 62% After Tax ROR (%) 59%
After Tax Payout (years) 1.4 After Tax Payout (years) 1.4
After Tax NPV10 ( million) 1.3 After Tax NPV10 ( million) 0.4
Recycle Ratio 3.0x Recycle Ratio 2.2x
F&D (/boe) 13.64 F&D (/boe) 17.11
Production Efficiency at IP30 (/boe/d) 11,100 Production Efficiency at IP30 (/boe/d) 8,200
Assumptions: WTI US55/bbl, LSB diff (US4.50)/bbl; AECO 1.50/mmbtu; escalated at 2%; CAD/USD 1.33 Assumptions: WTI US55/bbl, LSB diff (US4.50)/bbl; AECO 1.50/mmbtu; escalated at 2%; CAD/USD 1.33
ROBUST ECONOMICS FROM OUR INVENTORY OF SE SASKATCHEWAN LIGHT OIL ASSETS
* Operated and non-operated Frac Midale well performance in SE Saskatchewan from 2016 to December 2019. Operated and non-operated Open Hole Frobisher well performance in SE Saskatchewan from January 2018 to
December 2019. Some wells produce at restricted rates. ** IP30 and EUR rates based on historical results. EUR based on 2P reserves with internal adjustments to reflect remaining inventory. 57
Vermilion Energy Inc.
May 2020

Waterflood Leaders: Realizing Gains from Waterflood Expertise
Corporate Presentation
ICD improves recovery factor by controlling flow and creating even INJECTION CONTROL DEVICE (ICD)
water distribution through sleeves (50 ICDs installed as at YE 2017)
ICD pilots in the Viewfield Bakken have seen a rapid response,
offsetting oil production has increased 30% since installation
Testing new methods to further increase recovery including
nanosurfactants and conformance gels
Viewfield ICD Wells Historical Viewfield Water Injectors
(26 ICDs) 60 (167 injectors ex ICD) 600
50 600
50 500
500
Injection Rate, Bbl/d
40
Injection Rate, Bbl/d
40 400
Oil Rate, Bbl/d
Oil Rate, Bbl/d
400
30 300 30 300
200 20 200
20
100 10 100
Crescent Point Energy
10 0
0 0
-12 -10 -8 -6 -4 -2 0 2 4 6 8 10 12
-12 -6 0 6 12 18 24 30
Months (Pre and Post Install) Months (Pre and Post Install)
Oil Production Injection Oil Production Injection
Improving Recovery Factors and Increasing Sustainability
26
Waterflood data normalized to first injection
Crescent Point Energy Corp.
April 2018