

Service & Supply | Quarterly / Earnings Reports | Debt | Oilfield Services | Second Quarter (2Q) Update | Financial Results | Capital Markets
Pressure Pumper Exits Bankruptcy, Still Bleeding Cash; Report $84 Million Loss
 Print
|
Print
|
Seventy Seven Energy Inc. reported financial and operational results for the second quarter of 2016.
Highlights:
- Emerged from bankruptcy on August 1, 2016, which reduced debt by $1.115 billion
- Net Loss of $84.5 million
- Consolidated Adjusted EBITDA of $31.5 million
- 8 rigs currently operating in the Permian; over 30 new customers in the first half of the year
SSE reported total revenues of $138.1 million for the second quarter of 2016, an 11% decrease compared to revenues of $155.4 million for the first quarter of 2016, and a 53% decrease compared to revenues of $295.1 million for the second quarter of 2015.
Net loss for the second quarter of 2016 was $84.5 million, or $1.53 per fully diluted share, compared to net loss of $59.6 million, or $1.09 per fully diluted share, for the first quarter of 2016 and net loss of $74.7 million, or $1.50 per fully diluted share, for the second quarter of 2015. SSE's adjusted EBITDA was $31.5 million for the second quarter of 2016, compared to adjusted EBITDA of $37.9 million for the first quarter of 2016 and adjusted EBITDA of $44.3 million for the second quarter of 2015.
"We are pleased to have completed the prepackaged restructuring of our balance sheet while experiencing no disruption to our operations throughout the process. This $1.115 billion reduction in our debt provides us with the ability to take advantage of our operational strengths and strong asset base to grow our business when market conditions improve," Chief Executive Officer Jerry Winchester said.
"While we are seeing early signs of activity levels improving, we would caution that we have yet to see pricing respond. We remain focused on tightly managing our costs while continuing to operate safely and efficiently for our customers. Our continued emphasis on service quality is reflected in our diverse customer base, including over 30 new customers added to our portfolio in the first half of 2016."
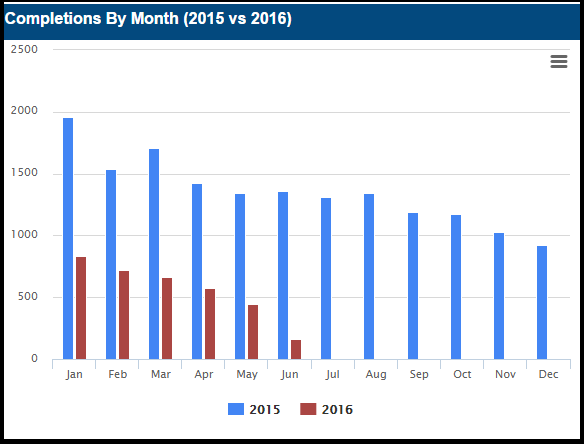
US Completions Activity (2015 vs 2016)
Drilling
SSE's drilling segment contributed revenues of $62.8 million and adjusted EBITDA of $40.6 million during the second quarter of 2016, compared to revenues of $71.9 million and adjusted EBITDA of $46.0 million for the first quarter of 2016 and revenues of $100.4 million and adjusted EBITDA of $45.7 million for the second quarter of 2015. The decrease in revenues for the second quarter of 2016 compared to the first quarter of 2016 was primarily due to an 18% decline in revenue days (which is the aggregate number of days each active rig generated revenue).
The percentage of revenues from non-CHK customers decreased from 39% to 37% of total segment revenues for the second quarter of 2016 compared to the first quarter of 2016. SSE's drilling segment generated revenues related to idle-but-contracted payments from CHK of $35.3 million and $36.2 million, respectively, during the second and first quarters of 2016. Excluding the idle-but-contracted revenues, the Company has diversified its customer base in the drilling segment and increased non-CHK revenue from 79% in the first quarter of 2016 to 85% in the second quarter of 2016. As of June 30, 2016, approximately 71% of SSE's active rigs were contracted by non-CHK customers and SSE had a total drilling revenue backlog of $220.1 million with an average duration of 11 months.
As a percentage of drilling revenues, drilling operating costs were 37% for the second quarter of 2016, 38% for the first quarter of 2016 and 57% for the second quarter of 2015. Operating costs were $23.0 million during the second quarter of 2016, compared to $27.2 million for the first quarter of 2016 and $57.1 million for the second quarter of 2015. Average operating costs per revenue day in the second quarter of 2016 increased 3% from the first quarter of 2016, primarily due to fewer revenue days.
As of June 30, 2016, the Company's marketed fleet consisted of 94 rigs, 74 of which are multi-well pad capable.
Hydraulic Fracturing
SSE's hydraulic fracturing segment contributed revenues of $66.9 million and adjusted EBITDA of $2.8 million during the second quarter of 2016, compared to revenues of $76.3 million and adjusted EBITDA of $6.5 million for the first quarter of 2016 and revenues of $163.4 million and adjusted EBITDA of $24.3 million for the second quarter of 2015. The decrease in revenues from the first quarter of 2016 to the second quarter of 2016 was primarily due to a 9% decrease in revenue per stage. Revenues from non-CHK customers as a percentage of total segment revenues decreased from 30% in the first quarter of 2016 to 21% in the second quarter of 2016. As of June 30, 2016, SSE's hydraulic fracturing revenue backlog was $89.8 million with an average duration of 10 months.
As a percentage of hydraulic fracturing revenues, hydraulic fracturing operating costs were 96% for the second quarter of 2016, 92% for the first quarter of 2016 and 86% for the second quarter of 2015. Average operating costs per stage in the second quarter decreased 5% from the first quarter of 2016. The decrease in average operating costs per stage for the second quarter of 2016 compared to the first quarter of 2016 was primarily due to a decrease in labor-related costs.
As of June 30, 2016, SSE owned 13 hydraulic fracturing fleets with an aggregate of 500,000 horsepower operating in the Anadarko Basin and the Eagle Ford and Utica shales.
Oilfield Rentals
SSE's oilfield rentals segment contributed revenues of $8.4 million and adjusted EBITDA of $0.1 million during the second quarter of 2016, compared to revenues of $7.1 million and adjusted EBITDA of ($1.7) million for the first quarter of 2016 and revenues of $17.8 million and adjusted EBITDA of ($1.9) million for the second quarter of 2015. Revenues from non-CHK customers as a percentage of total segment revenues decreased from 76% in the first quarter of 2016 to 48% in the second quarter of 2016.
As a percentage of oilfield rental revenues, operating costs were 100% for the second quarter of 2016, 127% for the first quarter of 2016 and 114% for the second quarter of 2015. The decrease in operating costs as a percentage of revenues was due to declines in labor-related costs and sub-contracting services in the second quarter of 2016 compared to both prior periods. Operating costs were $8.4 million during the second quarter of 2016, compared to $9.1 million for the first quarter of 2016 and $20.2 million for the second quarter of 2015.
Former Oilfield Trucking
During the second quarter of 2015, SSE sold its drilling rig and logistics business and water hauling assets. As of June 30, 2015, there were no remaining assets or operations in the oilfield trucking segment, although we do have ongoing liabilities, primarily related to insurance claims, whose income statement impact is charged to general and administrative expense.
General and Administrative Expenses
General and administrative expenses were $39.7 million in the second quarter of 2016, compared to $22.3 million in the first quarter of 2016 and $34.8 million in the second quarter of 2015. General and administrative expenses for corporate functions settled in cash were $11.8 million in the second quarter of 2016, compared to $12.7 million in the first quarter of 2016 and $23.1 million in the second quarter of 2015. The decrease was primarily due to declines in consulting fees.
SSE incurred restructuring charges of $23.5 million and $4.7 million in the second quarter of 2016 and first quarter of 2016, respectively. Additionally, general and administrative expenses include non-cash compensation of $4.1 million, $4.5 million and $8.6 million, for the second quarter of 2016, first quarter of 2016 and second quarter of 2015, respectively, and severance-related costs of $0.3 million for both the second and first quarters of 2016 and $3.1 million for the second quarter of 2015. Below is a breakout of general and administrative expenses incurred in the second and first quarters of 2016 and the second quarter of 2015.
Liquidity
As of June 30, 2016, SSE had cash and short-term investments of $81.4 million and working capital of $187.9 million. As of August 4, 2016, SSE had cash and short-term investments of $50.3 million and the Company's revolving credit facility remained undrawn. As of June 30, 2016, SSE had $14.0 million of purchase commitments related to future capital expenditures that the Company expects to incur during the second half of 2016.
Capital expenditures totaled $21.9 million for the second quarter of 2016, which primarily consisted of investments in new PeakeRigs™. For the six months ended June 30, 2016, capital expenditures totaled $76.1 million. SSE currently expects its total year-end 2016 capital expenditures to be less than $100.0 million.
On June 7, 2016, the Company and its wholly owned subsidiaries filed bankruptcy petitions for reorganization under Chapter 11 in the United States Bankruptcy Court for the District of Delaware (the "Bankruptcy Court"). On July 14, 2016, the Bankruptcy Court entered an order confirming the Plan. The Company and its wholly owned subsidiaries satisfied the remaining conditions to effectiveness contemplated under the Company's Joint-Prepackaged Plan of Reorganization and emerged from Chapter 11 on August 1, 2016.
SSE expects its primary sources of liquidity will be from cash on hand and cash from operations. In addition, the Company entered into a $100.0 million senior secured asset-based revolving credit facility upon emerging from the Chapter 11 proceeding.
More Second Quarter (2Q) Update News

Berry Reaffirms FY25 Guidance; Uinta Wells Drive 2H Growth
Berry Corporation delivered a steady second quarter update that reinforced the company’s core message for 2025: production is on plan, guidance is intact, and the hedge book is…

SM Energy Hits Record Output; Driven by Uinta
In Q2 2025, SM Energy (NYSE: SM) delivered a performance that underscored its evolution from a mid-cap E&P into a streamlined, tech-enabled operator executing a multibasin optimization strategy.…

Expand Energy Talks, Wells, Frac Crews, Production For 2H-2025
In the second half of 2025, Expand Energy is not chasing production growth — it's engineering it. Fresh off record-setting drilling performance in Q2, the company is approaching…

Comstock Rides Higher Gas Prices, Operational Momentum in Q2 2025
Comstock Resources delivered a resilient second quarter, capitalizing on higher natural gas prices and solid well results across the Haynesville and Bossier plays. The company reported strong production…

A Quarter of Quiet Strength: CNX’s Patient Ascent in Appalachia
In the heart of Appalachia, CNX Resources continued to methodically execute on a playbook built for resilience and long-term value. Q2 2025 marked the company’s 22nd consecutive quarter…
United States News

A Quiet Capital Pattern Is Forming in North American Upstream — and Almost No One Is Talking About It
A handful of recent transactions and capital raises point to a subtle pattern in North American upstream—one that is easy to miss because each event, on its own,…

EIA’s “Glut” Calls: The 2025 Surplus Claim — and How 2021–2024 Forecasts Actually Held Up
The “~2.2 MMb/d glut in 2025” framing traces to the EIA’s Short-Term Energy Outlook (STEO), December 2025. EIA doesn’t usually write “glut” in the tables—what they publish is…

New E&P Scores Capital; Heading To the MidCon Region
Company Overview 406 Energy, LLC is a newly formed, Houston-based upstream oil & gas development company launched in October 2025 with an initial equity commitment from NGP Natural…

2025 Forecast : Dangerous Time Ahead
This is the time of year when we share a clear view into how we’re thinking about what to expect for drilling and completion activity in 2025. To…

Petrus Resources Ltd. First Quarter 2023 Results
Petrus Resources Ltd. announced first quarter 2023 results. Highlights Higher production – Production was up 54% from 7,379 boe/d(1) in the first quarter of 2022 to 11,385 boe/d…