

Quarterly / Earnings Reports | Second Quarter (2Q) Update
SM Energy Details Q2 2019 Well Results, Financials
 Print
|
Print
|
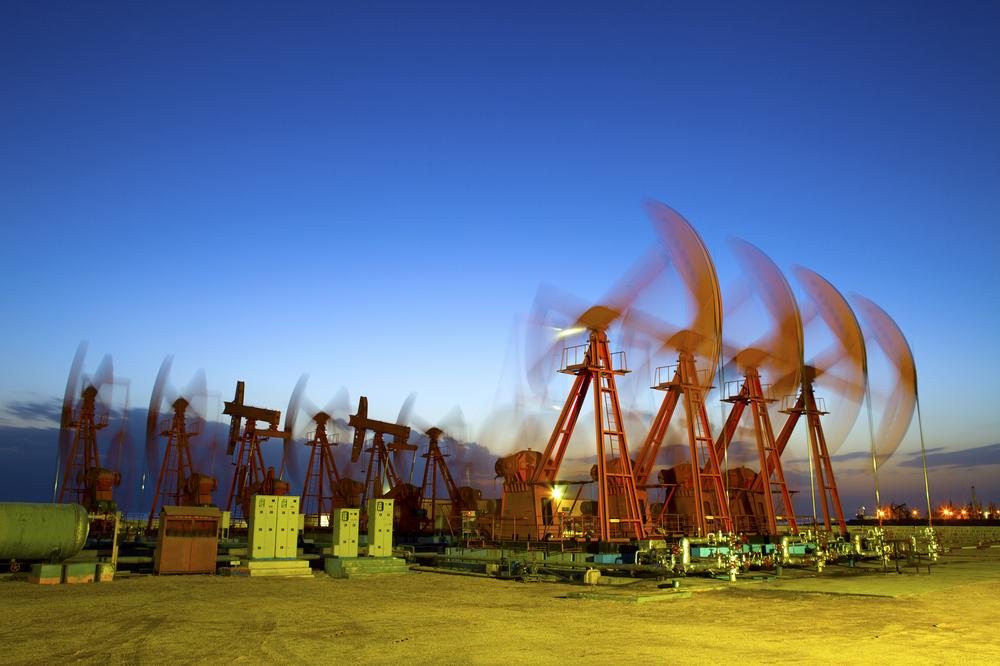
SM Energy Co. announced financial and operating results for the second quarter of 2019.
Highlights include:
- Better wells at lower costs - As previously reported, second quarter production of 12.4 MMBoe (136.5 MBoe/d), was up 19% from the second quarter of 2018 and up 16% sequentially, as performance from both the Midland Basin and South Texas exceeded expectations. Oil production of 5.4 MMBbls (60 MBbls/d) was up 24% from the second quarter of 2018 and 12% sequentially. Second quarter 2019 costs incurred in oil and gas activities was $269 millionand total capital spend (total capital spend is a non-GAAP measure; see below for definition and reconciliation) was $261 million. Total capital spend was below guidance and reflects continued cost savings.
- Strong production drove solid earnings and cash flow - Net income was $50.4 million; EPS was $0.45 per diluted common share, and adjusted EPS was $0.01 per diluted common share; net cash provided by operating activities was $259.9 million and adjusted EBITDAX was $263.0 million, up 41% sequentially (adjusted EPS and adjusted EBITDAX are non-GAAP measures; see below for definition and reconciliation).
- Best in class well performance - The Sarah Connor 1050WA well set SM's record as its top performing Midland Basin well to date, based on a peak 30-day IP rate of 2,426 Boe/d (93% oil) from a 10,366 foot lateral. 27 new RockStar wells across five intervals reached 30-day peak IP rates averaging 1,250 Boe/d per well and 87% oil.
- Value enhancement through successful interval tests - Four new horizons have continued to deliver encouraging results, including the Company's previously announced Austin Chalk wells in South Texas and its first Middle Spraberry, Dean and Wolfcamp D tests in RockStar.
President and Chief Executive Officer Jay Ottoson comments: "Our excellent performance is the result of having some of the best assets in the Midland Basin combined with continued outstanding operational execution. This year, operational efforts include well tests from South Texas and the Midland Basin on four new horizons that, while early, remain encouraging for organic inventory growth and value creation. Adjusted EBITDAX for the second quarter was the highest recorded since 2015, despite lower natural gas and NGL prices. We are generating top tier returns, continuing to drive higher operating margins and are on course with our long-term plan to deliver a positive free cash flow yield and de-lever the balance sheet."
Well Results
New well results include RockStar area wells that reached their 30-day peak IP rates subsequent to the Company's May 2019 update and new interval exploration results in both the RockStar area and South Texas.
- Results from 27 new RockStar wells, having an average lateral length of 10,552 feet, delivered 30-day peak IP rates that averaged 1,250 Boe/d per well and 87% oil. This includes wells across five intervals, 24 of which were fully or half bounded.
- By interval, results included 13 Wolfcamp A wells averaging 1,326 Boe/d per well, two Wolfcamp B wells averaging 902 Boe/d per well, and 10 Lower Spraberry wells averaging 1,076 Boe/d per well.
- As previously reported, new interval tests at RockStar targeting the Dean and Wolfcamp D reached 30-day peak rates of approximately 1,550 Boe/d (92% oil) and approximately 1,400 Boe/d (80% oil and naturally flowing), respectively. New interval tests at RockStar continue to be encouraging and the Company plans to include additional tests in future programs.
- All 25 wells that are part of the Merlin Maximus development have now reached their 30-day peak IP rates, averaging approximately 1,400 Boe/d per well and 86% oil.
- As previously reported, the Company's Watson State Austin Chalk test in South Texas continues to show encouraging results with a 30-day peak IP rate that averaged approximately 3,200 Boe/d (3-stream) with approximately 55% liquids from a 12,875 foot lateral. Both Austin Chalk test wells continue to perform well and, based on their success, the Company has planned two additional tests, both of which are expected to start producing in the fourth quarter. The Austin Chalk presents the potential for higher margin and higher return wells due to higher liquids content and lower transportation costs per Boe.
Q2 2019 Results
Second quarter of 2019 production was 12.4 MMBoe, or 136.5 MBoe/d, with 44% oil in the commodity mix. Second quarter realized prices (before the effects of hedges) averaged $32.75 per Boe. The Company realized a $4.1 million, or $0.32 per Boe, gain after the effects of hedges.
Second quarter of 2019 net income was $50.4 million, or $0.45 per diluted common share, compared with net income of $17.2 million, or $0.15 per diluted common share, in the second quarter of 2018. For the first six months of 2019, net loss was ($127.2) million or ($1.13) per diluted common share.
Second quarter of 2019 net cash provided by operating activities was $259.9 million. For the first six months of 2019, net cash provided by operating activities was $378.4 million.
The following paragraphs discuss adjusted net income (loss), adjusted net income (loss) per diluted common share, and adjusted EBITDAX, all of which are non-GAAP measures. Please reference the definitions and reconciliations of these measures to the most directly comparable GAAP financial measures at the end of this release.
Second quarter of 2019 adjusted EBITDAX was $263.0 million. Adjusted EBITDAX is up 17% year-over-year and up 41% sequentially. The increase in adjusted EBITDAX year-over-year was primarily driven by a production increase of 19% and per unit operating costs down by 11%, partially offset by lower realized prices (post-hedge). The sequential increase in adjusted EBITDAX was driven by a 16% increase in total production, including a 12% increase in oil production and a 14% decline in per unit operating costs. For the first six months of 2019, adjusted EBITDAX was $449.5 million.
Second quarter of 2019 adjusted net income was $1.3 million, or $0.01 per diluted common share, compared with adjusted net income of $16.8 million, or $0.15 per diluted common share, in the second quarter of 2018. For the first six months of 2019, adjusted net loss was ($36.4) million, or ($0.32) per diluted common share.
Hedges
As of July 31, 2019, the Company had commodity derivatives in place for the third and fourth quarters of 2019 and fiscal year 2020, including:
- WTI oil hedges for approximately 80% of expected second half 2019 and approximately 50% + of expected 2020 oil production;
- HSC natural gas hedges for approximately 70% of expected second half 2019 production;
- Midland-Cushing differential hedges for approximately 60% of expected second half 2019 and expected 2020 Permian oil production; and
- WAHA natural gas hedges for approximately 70% of expected second half 2019 Permian residue natural gas production
Detailed data on derivatives are provided in the accompanying IR presentation and the Company's Quarterly Report on Form 10-Q for the second quarter of 2019.
More Quarterly Report Basic News

Range Resources Second Quarter 2021 Results
Range Resources Corp. announced its second quarter 2021 financial results. Highlights: Realizations before index hedges of $3.25 per mcfe, or approximately $0.41 above NYMEX natural gas Pre-hedge NGL…

Ovintiv Inc. Second Quarter 2021 Results
Ovintiv Inc. announced its second quarter 2021 financial and operating results. In addition, the Company increased its quarterly dividend payment by approximately 50%, accelerated its $4.5 billion net…

Schlumberger Second Quarter 2021 Results; Q2 Revenue Comparison
Schlumberger reported results for the second-quarter 2021. Highlights: Global revenue of $5.6 billion increased 8% sequentially International revenue was $4.5 billion and North America revenue was $1.1 billion…

PHX Minerals Fiscal First Quarter 2021 Results
PHX Minerals Inc. reported financial and operating results for the first quarter ended Dec. 31, 2020. Highlights: Production volumes for the first fiscal quarter of 2021 were 2,074…

ConocoPhillips Fourth Quarter, Full Year 2020 Results
ConocoPhillips reported its 4Q and full year 2020 results. Conoco reported a fourth-quarter 2020 loss of $0.8 billion, or ($0.72) per share, compared with fourth-quarter 2019 earnings of…
Gulf Coast News

Why $90 Oil Isn’t Bringing Back the Rigs
Higher oil prices are not translating cleanly into a drilling response across U.S. shale, and company disclosures are starting to show why. The issue is not simply capital…

These Three Companies Will Increase Drilling & Completion Over The Next 3 Year
In the span of fifteen months, three Japanese energy companies committed more than $10.3 billion to U.S. natural gas production assets — a buying spree that has transferred…

Q1 A&D Transactions Jump to $30B , While Deal Flow Was Down 40%
The first quarter of 2026 has officially defined the "Barbell Era" of American oil and gas. While the total number of deals plummeted by 46% YoY (dropping to…

Wright to U.S. Oil Industry: The Price Signal Is Telling You to Drill
Energy Secretary Chris Wright stood in front of the largest gathering of oil executives in the world this morning and delivered a message that was equal parts market…

Apa Corp : Doing More With Less
APA's 2025 narrative was one of operational surprise. The company came in beating production guidance every single quarter while spending below plan, capturing over $300MM in cost savings…
Gulf Coast - South Texas News

Permian Resources to Grow Production 6% in 2026
Permian Resources exited 2025 as the largest pure-play Delaware Basin operator with ~480,000 net acres and >105,000 net royalty acres. The company averaged 392.6 MBoe/d in 2025, including…

Battalion Oil Closes ~$60M West Quito Draw Asset Sale
Battalion Oil Corporation has closed the sale of its West Quito Draw assets in the Southern Delaware Basin to MCM Delaware Resources LLC, a subsidiary of MCM Energy…

Deal Rumor: ConocoPhillips Exploring $2B Permian Asset Sale
ConocoPhillips is reportedly exploring the potential sale of certain Permian Basin assets in a transaction valued at approximately $2 billion, according to Reuters, citing sources familiar with the…

An Eagle Ford Team That Cashed Out Is Back for Another Cycle
Houston — January 15, 2026 — Lime Rock Partners, a Houston-based private investment firm specializing in upstream oil and gas, has completed an equity commitment to Athena Energy…

Silver Hill Expands South Texas Footprint with Acquisition of 1776 Energy Assets
Silver Hill Energy Partners has acquired 100 percent of 1776 Energy’s South Texas oil and gas assets, significantly expanding its operated footprint across the Eagle Ford and Austin…