

Exploration & Production | Quarterly / Earnings Reports | Second Quarter (2Q) Update | Production Rates | Forecast - Production | Hedging | Capital Markets | Capital Expenditure | Drilling Program
Baytex Slows Spending and Drilling in Eagle Ford, Canada
 Print
|
Print
|
2.jpg)
Baytex Energy Corp. has reported its operating and financial results for the three and six months ended June 30, 2015 (all amounts are in Canadian dollars unless otherwise noted).
Highlights
- Generated production of 84,812 boe/d (82% oil and NGL) in Q2/2015;
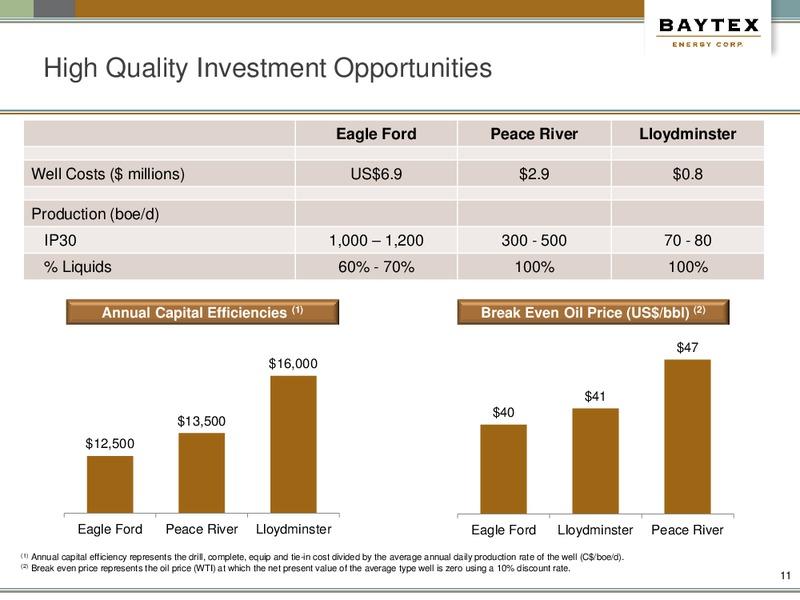
- Advanced the multi-zone development potential of our Eagle Ford acreage with 30-day initial production rates per well ranging from 900 to 1,600 boe/d for two projects that targeted three separate horizons;
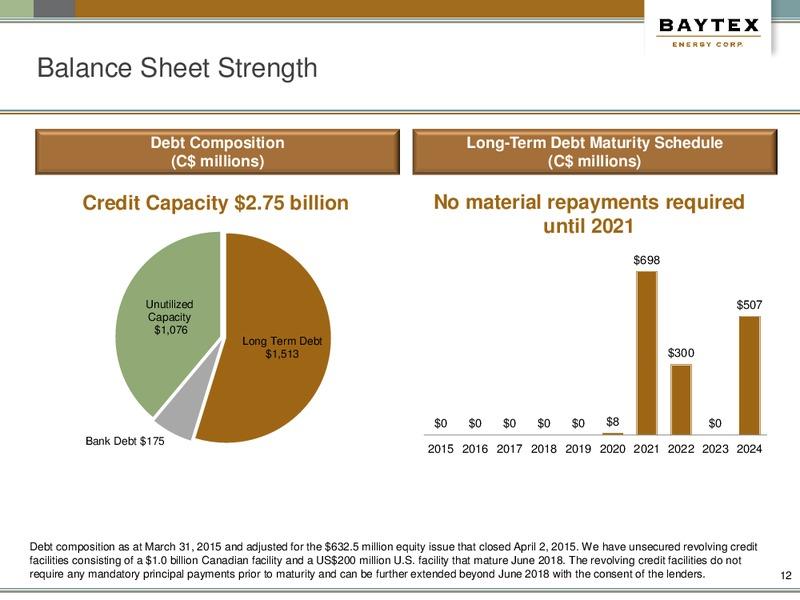
- Completed an equity financing on April 2, 2015, raising net proceeds of approximately $606 million which were applied to reduce outstanding indebtedness.
Operations Review
- During the second quarter, we continued to execute our 2015 capital program as planned and our results are consistent with expectations. In response to the weakness in commodity prices, our overall level of capital spending was lower for the third consecutive quarter as we deferred activity in Canada and reduced activity in the Eagle Ford. Reflective of this reduced activity, production averaged 84,812 boe/d (82% oil and NGL) in Q2/2015 as compared to 90,710 boe/d in Q1/2015. Capital expenditures for exploration and development activities totaled $106.0 million in Q2/2015, down from $147.4 million in Q1/2015, and $214.7 million in Q4/2014. In Q2/2015, we participated in the drilling of 51 (15.2 net) wells with a 100% success rate.
- One of our key attributes is our portfolio of projects with strong capital efficiencies and high rates of return. Through negotiated cost savings with service providers, our portfolio of development opportunities in the Eagle Ford, Peace River and Lloydminster continue to provide attractive returns in today's low crude oil price environment.
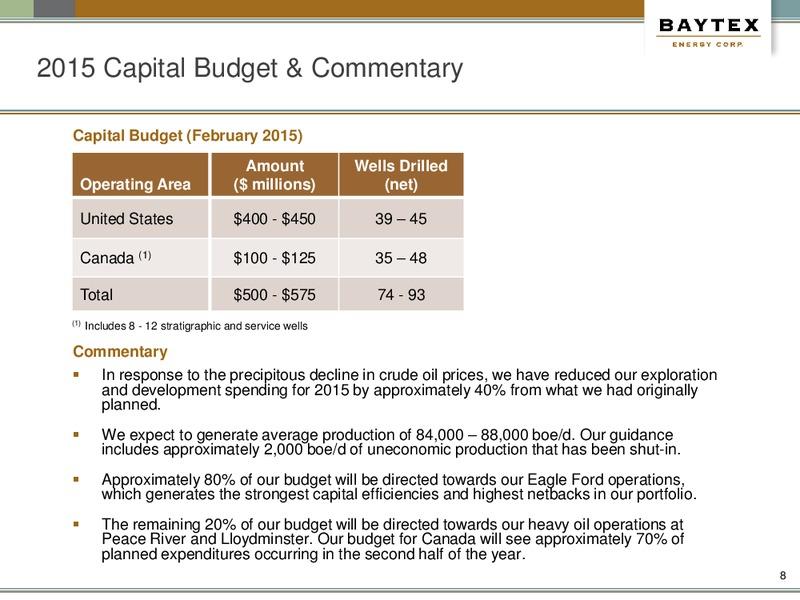
- Our 2015 production guidance remains at 84,000 to 88,000 boe/d with budgeted exploration and development expenditures of $500 to $575 million. Our 2015 capital program remains flexible and allows for adjustments to second half spending based on changes in the commodity price environment.
U.S. Operations
- Production in the Eagle Ford averaged 39,548 boe/d (79% oil and NGL) during Q2/2015, as compared to 41,076 boe/d in Q1/2015 and 38,035 boe/d in Q4/2014.
- Capital expenditures in the Eagle Ford in Q2/2015 totaled $98.3 million, down from $126.2 million in Q1/2015 and $149.5 million in Q4/2014. This reduction is reflective of reduced activity levels combined with negotiated cost savings with service providers.
- We continued to scale back our activity during the second quarter as we adjust to the lower crude oil pricing environment. We reduced the number of drilling rigs on our lands from 12 in late 2014 to 5 currently. In addition, the number of frac crews has been reduced from three in late 2014 to one or two currently.
- During the second quarter, 40 (11.6 net) wells were brought onstream, as compared to 52 (13.2 net) wells during the first quarter. Of the 40 wells that commenced production during the second quarter, 27 wells have been producing for more than 30 days and have established an average 30-day initial production rate of approximately 1,200 boe/d. As at June 30, 2015, we had 83 (20.3 net) wells awaiting completion.
- In addition to targeting the Lower Eagle Ford formation, we are now actively delineating the Austin Chalk formation. The number of wells on our lands producing from the Austin Chalk is now 37 (10.7 net) with an average 30-day initial production rate of approximately 1,000 boe/d.
- Additional advancements have been made to delineate the multi-zone development potential of our Sugarkane acreage. We have initiated "stack and frac" pilots which target up to three zones in the Eagle Ford formation in addition to the overlying Austin Chalk. Recent production data from two pads (a total of nine wells) that targeted three zones achieved 30-day initial production rates per well ranging from 900 to 1,600 boe/d. We now have eleven multi-zone projects in various stages of execution and production.
Canadian Operations
- Production in Canada averaged 45,264 boe/d (85% oil and NGL) during Q2/2015, as compared to 49,634 boe/d in Q1/2015. The reduced volumes in Canada are a result of lower drilling activity, the decommissioning of our Gemini steam-assisted gravity drainage pilot project and uneconomic production that we have shut-in. Capital expenditures for our Canadian assets in Q2/2015 totaled $7.7 million, down from $21.3 million in Q1/2015.
- At Lloydminster, we drilled two (2.0 net) horizontal wells. At Peace River, no drilling occurred in Q2/2015.
- During the quarter, the commissioning of Phase One of the Genalta Peace River Power Centre was completed resulting in Baytex delivering approximately 3.5 mmcf/d of natural gas to the facility for the purpose of generating electricity. In Q3/2015, Phase Two of the project is anticipated to be commissioned, resulting in the conservation of an additional 0.7 mmcf/d of natural gas and total electrical generation equivalent to the needs of over 23,000 homes in Alberta.
Risk Management
- We employ a comprehensive risk management program which is intended to reduce some of the volatility in our FFO. In Q2/2015, we realized financial derivatives gains of $40.1 million, primarily due to crude oil prices being at levels significantly below those set in our fixed price contracts, which were partially offset by the settlement of our out-of-money foreign exchange contracts.
- For Q3/2015, we have entered into hedges on approximately 24% of our net WTI exposure with 17% fixed at US$79.86/bbl and 7% receiving WTI plus US$10.00/bbl when WTI is below US$80.00/bbl. The unrealized financial derivatives gain with respect to our WTI hedges as at June 30, 2015 was $45.7 million. The following table summarizes our WTI hedges in place as at July 29, 2015.
Canada News

Western Canada Upstream M&A: Q1 2026 Transaction Report
Western Canadian M&A activity in Q1 2026 was characterized by a 87% decrease in total deal value compared to Q1 2025, totaling $0.8 billion C$. However, transaction volume…

An Eagle Ford Team That Cashed Out Is Back for Another Cycle
Houston — January 15, 2026 — Lime Rock Partners, a Houston-based private investment firm specializing in upstream oil and gas, has completed an equity commitment to Athena Energy…

Silver Hill Expands South Texas Footprint with Acquisition of 1776 Energy Assets
Silver Hill Energy Partners has acquired 100 percent of 1776 Energy’s South Texas oil and gas assets, significantly expanding its operated footprint across the Eagle Ford and Austin…

Canadan E&P 2026 Program Calls for 448 Net Wells, Up 24% vs. 2025 Plan
Canadian Natural Resources outlined a 2026 operating capital budget of approximately $6.3 billion (total capital budget $6,425 million, including $125 million for carbon capture) targeting 1,590–1,650 MBOE/d of…

EIA’s “Glut” Calls: The 2025 Surplus Claim — and How 2021–2024 Forecasts Actually Held Up
The “~2.2 MMb/d glut in 2025” framing traces to the EIA’s Short-Term Energy Outlook (STEO), December 2025. EIA doesn’t usually write “glut” in the tables—what they publish is…
Gulf Coast - South Texas News

Whitecap Details 2026 Duvernay & Montney Program
Whitecap Resources reported strong third quarter 2025 operating and financial results, marking its first full quarter following the strategic combination with Veren that closed on May 12, 2025.…

ARC Resources: Lower 2026 Capex, Higher Volumes
ARC Resources used its third quarter update to reinforce a familiar message to Canadian E&P executives: disciplined capital, structurally better market access, and a growing shareholder return program…

Baytex 2026 Development Plans
Baytex’s 2026 development plan reflects a post–Eagle Ford sale capital program and a sharpened focus on its core Canadian assets. The Company approved 2026 exploration and development expenditures…

Tourmaline: 2026 Capital Program Locked In at $2.9B
Tourmaline’s 2026 exploration and production (EP) program is set at $2.9 billion and targets average production of 690,000–710,000 boepd, with the company maintaining the multi-year EP Plan released…

Cenovus Outlines 2026 Development Plan Following MEG Integration
Cenovus’ 2026 plan targets capital investment of $5.0 billion to $5.3 billion (including ~$350 million of capitalized turnaround costs) and upstream production of 945,000 BOE/d to 985,000 BOE/d,…