

Quarterly / Earnings Reports | Second Quarter (2Q) Update | Financial Results | Hedging | Capital Markets | Capital Expenditure | Drilling Activity | 2020 Guidance
Oasis Petroleum Second Quarter 2020 Results
 Print
|
Print
|

Oasis Petroleum Inc. reported its Q2 2020 results and updated its 2020 outlook.
2Q20 Highlights:
- Delivered net cash used in operating activities of $47.9 million and Adjusted EBITDA of $174.2 million in 2Q20.
- Produced 54.1 MBoepd in 2Q20 with oil volumes at 36.4 MBopd
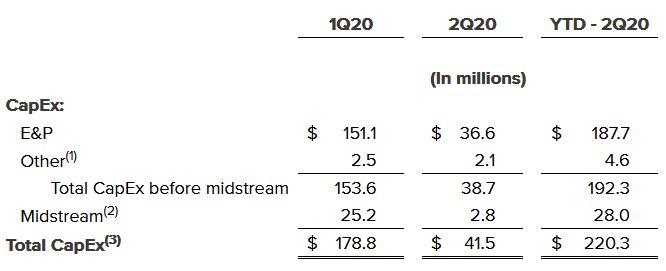
- E&P CapEx was $36.9 million for 2Q20
- LOE per Boe decreased 12% to $6.01 per Boe in 2Q20 as compared to $6.83 per Boe in 1Q20
- Crude oil differentials were solid over 2Q20, averaging $2.90 off of NYMEX WTI
- E&P pre-tax loss was $116.4 million and E&P Free Cash Flow was $92.7 million in 2Q20
- Midstream pre-tax income including non-controlling interests was $25.3 million and Midstream Adjusted EBITDA(1) was $44.2 million in 2Q20. Oasis Midstream Partners LP declared a distribution of $0.54 per unit, unchanged from 1Q20
- Continued to achieve industry-leading gas capture of approximately 96% across the entire Williston position and approximately 93% in the Delaware position
Updated 2020 Outlook
- Expecting 2H20 E&P CapEx of $60 million to $75 million. Full year 2020 E&P CapEx of $248 million to $263 million is 54-58% below original February 2020 guidance and towards the low-end of the CapEx range provided in May 2020.
- Volumes have steadily increased from trough levels observed in May 2020. 3Q20 and 4Q20 oil volumes are expected to approximate 40-42 MBopd, approximately 13% above 2Q20 levels based on current market conditions.
- Expecting to generate free cash flow at strip NYMEX WTI prices based on the Company's revised 2020 plan.
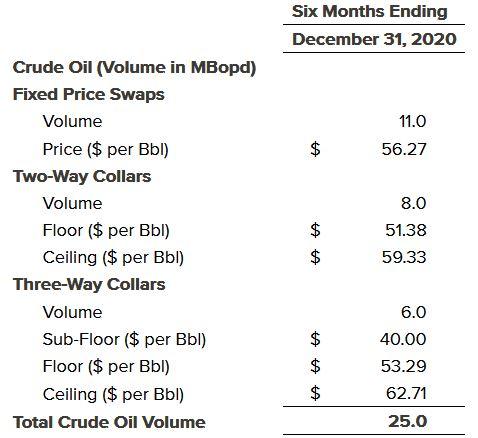
- 2H20 hedged volumes of 25 MBopd drive mark-to-market value of $85 million as of June 30, 2020.
- Midstream CapEx is expected to range between $5 million to $10 million in 2H20. Full year 2020 midstream CapEx of $36 million to $40 million is more than 60% below original February 2020 guidance. Approximately 25% of 2020 midstream CapEx is attributed to Oasis. See the Oasis Midstream Partners LP ("OMP") press release issued on August 5, 2020 for more details.
Chairman and Chief Executive Officer, Thomas B. Nusz, commented, "Oasis executed well through an exceptionally tumultuous period. The Oasis team responded swiftly and effectively, powering down activity in an orderly manner, significantly lowering operating cost structure and capital while maintaining the integrity of our infrastructure to enhance flexibility for the future. The team was successful in keeping per unit lease operating expense low despite significant shut-ins reflecting meticulous cost management, including a carefully planned curtailment process, pricing concessions, labor optimization, and deferring workovers. Strip pricing has improved materially, but Oasis will maintain a prudent approach to future activity. Capital efficiency improvements and a significantly lower cost structure will improve economics for future development. Additionally, cash generation and free cash flow benefit from a robust hedge position and our midstream ownership which continues to support industry leading gas capture. As always, we remain focused on the health and safety of our employees, contractors, and communities."
Select Financial Metrics
The following table presents select financial data for the period presented:
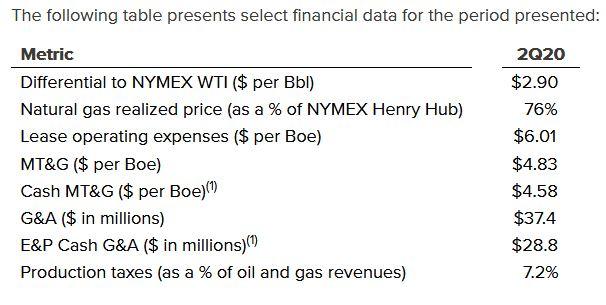
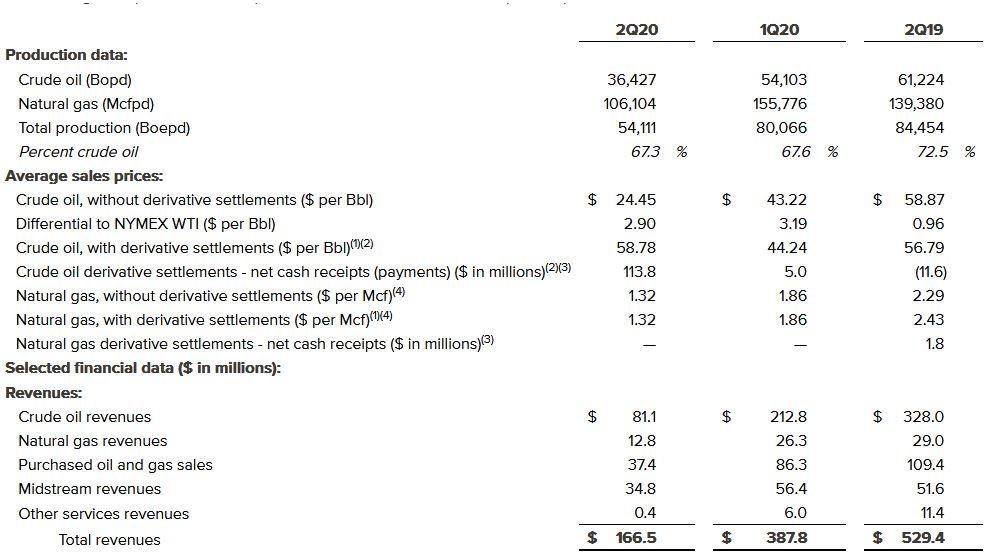
G&A totaled $37.4 million in 2Q20, $30.9 million in 2Q19 and $31.2 million in 1Q20. Amortization of equity-based compensation, which is included in G&A, was $4.9 million, or $0.99 per barrel of oil equivalent ("Boe"), in 2Q20 as compared to $8.9 million, or $1.16 per Boe, in 2Q19 and $6.8 million, or $0.93 per Boe, in 1Q20. G&A for the Company's E&P segment, excluding G&A expenses attributable to other services, totaled $33.5 million in 2Q20, $25.8 million in 2Q19 and $23.3 million in 1Q20. E&P Cash G&A (non-GAAP) expenses, excluding G&A expenses attributable to other services, non-cash equity-based compensation expenses and other non-cash charges, were $5.84 per Boe in 2Q20, $2.24 per Boe in 2Q19 and $2.29 per Boe for 1Q20. For a definition of E&P Cash G&A expenses and a reconciliation of G&A expenses to E&P Cash G&A, see "Non-GAAP Financial Measures" below.
Impairment expense was $2.3 million in 2Q20 as compared to $4.8 billion in 1Q20. In 2Q20, the Company recorded impairment charges of $1.0 million on its equipment and materials inventory, $0.8 million on its unproved oil and gas properties and $0.6 million on its prepaid midstream equipment. In 1Q20, the Company recorded impairment charges of $4.4 billion on its proved oil and gas properties in the Williston Basin and the Delaware Basin, $291.3 million on its unproved oil and gas properties, $108.3 million on its midstream assets and $15.8 million on its well services assets.
Interest expense was $44.4 million in 2Q20 as compared to $43.2 million in 2Q19 and $95.8 million in 1Q20. Capitalized interest totaled $1.8 million in 2Q20, $3.6 million in 2Q19 and $2.3 million in 1Q20. Cash Interest (non-GAAP) totaled $39.0 million in 2Q20, $42.0 million in 2Q19 and $93.5 million in 1Q20. For a definition of Cash Interest and a reconciliation of interest expense to Cash Interest, see "Non-GAAP Financial Measures" below.
In 2Q20, the Company recorded an income tax benefit of $2.6 million, resulting in a 2.7% effective tax rate as a percentage of its pre-tax loss for the quarter. In 1Q20, the Company recorded an income tax benefit of $254.7 million, resulting in a 5.6% effective tax rate as a percentage of its pre-tax loss for the quarter.
In 2Q20, the Company reported a net loss of $92.9 million, or $0.29 per diluted share, as compared to net income of $42.8 million, or $0.14 per diluted share, in 2Q19. Excluding certain non-cash items and their tax effect, Adjusted Net Income Attributable to Oasis (non-GAAP) was $73.5 million, or $0.23 per diluted share, in 2Q20, as compared to Adjusted Net Income Attributable to Oasis of $11.0 million, or $0.03 per diluted share, in 2Q19. Adjusted EBITDA (non-GAAP) in 2Q20 was $174.2 million, which included $25.3 million for derivatives monetized in 2Q20, as compared to Adjusted EBITDA of $249.6 million in 2Q19. For definitions of Adjusted Net Income (Loss) Attributable to Oasis and Adjusted EBITDA and reconciliations to the most directly comparable financial measures under GAAP, see "Non-GAAP Financial Measures" below.
Capital Expenditures and Completions
The following table presents the Company's total capital expenditures ("CapEx") by category for the periods presented:
Oasis completed 3 gross (1.9 net) operated wells in the Williston Basin and 6 gross (5.0 net) operated wells in the Delaware Basin.
Liquidity and Balance Sheet
As of June 30, 2020, Oasis had cash and cash equivalents of $77.4 million, total elected commitments under its revolving credit facility (the "Oasis Credit Facility") of $612.5 million and total elected commitments under the revolving credit facility among OMP, as parent, OMP Operating LLC, a subsidiary of OMP, as borrower, Wells Fargo Bank, N.A., as administrative agent and the lenders party thereto (the "OMP Credit Facility") of $575.0 million. In addition, Oasis had $502.0 million of borrowings and $71.6 million of outstanding letters of credit issued under the Oasis Credit Facility and $487.5 million of borrowings and a de minimis outstanding letter of credit issued under the OMP Credit Facility.
Hedging Activity
The Company's crude oil contracts will settle monthly based on the average NYMEX West Texas Intermediate crude oil index price ("NYMEX WTI") for fixed price swaps and two-way and three-way costless collars. During 2Q20, the Company liquidated certain NYMEX WTI three-way costless collars for $25.3 million. As of August 5, 2020, the Company had the following outstanding commodity derivative contracts:
More Second Quarter (2Q) Update News

Berry Reaffirms FY25 Guidance; Uinta Wells Drive 2H Growth
Berry Corporation delivered a steady second quarter update that reinforced the company’s core message for 2025: production is on plan, guidance is intact, and the hedge book is…

SM Energy Hits Record Output; Driven by Uinta
In Q2 2025, SM Energy (NYSE: SM) delivered a performance that underscored its evolution from a mid-cap E&P into a streamlined, tech-enabled operator executing a multibasin optimization strategy.…

Expand Energy Talks, Wells, Frac Crews, Production For 2H-2025
In the second half of 2025, Expand Energy is not chasing production growth — it's engineering it. Fresh off record-setting drilling performance in Q2, the company is approaching…

Comstock Rides Higher Gas Prices, Operational Momentum in Q2 2025
Comstock Resources delivered a resilient second quarter, capitalizing on higher natural gas prices and solid well results across the Haynesville and Bossier plays. The company reported strong production…

A Quarter of Quiet Strength: CNX’s Patient Ascent in Appalachia
In the heart of Appalachia, CNX Resources continued to methodically execute on a playbook built for resilience and long-term value. Q2 2025 marked the company’s 22nd consecutive quarter…
Rockies News

Why $90 Oil Isn’t Bringing Back the Rigs
Higher oil prices are not translating cleanly into a drilling response across U.S. shale, and company disclosures are starting to show why. The issue is not simply capital…

Q1 A&D Transactions Jump to $30B , While Deal Flow Was Down 40%
The first quarter of 2026 has officially defined the "Barbell Era" of American oil and gas. While the total number of deals plummeted by 46% YoY (dropping to…

Wright to U.S. Oil Industry: The Price Signal Is Telling You to Drill
Energy Secretary Chris Wright stood in front of the largest gathering of oil executives in the world this morning and delivered a message that was equal parts market…

This Operator Will Chop it's 2026 Rig Count From 34 to 24
ConocoPhillips is setting up 2026 as a lower-intensity, more efficient operating year — with the clearest proof coming from the Lower 48 activity reset following the Marathon integration.…

A Quiet Capital Pattern Is Forming in North American Upstream — and Almost No One Is Talking About It
A handful of recent transactions and capital raises point to a subtle pattern in North American upstream—one that is easy to miss because each event, on its own,…
Williston Basin News

Permian E&P Bucking The Trend; Plan to Increasing Drilling & Fracs in 2026
Occidental’s 2025 U.S. onshore program is centered on the Permian, with ~$3.5B of Permian CapEx and ~$0.8B in the Rockies, totaling ~$4.3B. This supports ~15 net rigs in…

Bakken Midstream Project shelved; as future growth projects thin
Hess Midstream highlighted continued throughput growth across its Williston Basin (Bakken/Three Forks) systems, signaling higher utilization in gas gathering and processing. For producers, the only forward-looking capacity signal…

Japex Enters DJ Basin with Acquistion of Verdad
Japan Petroleum Exploration Co., Ltd. (JAPEX) has announced a major expansion into North American shale with a $1.3 billion acquisition of Verdad Resources Intermediate Holdings LLC (VRIH), marking…

Dallas Fed Energy Survey: What Oil and Gas Executives Are Really Saying
The latest Dallas Fed Energy Survey shows a U.S. oil and gas industry that is not collapsing—but is clearly constrained. Executives are operating in a defensive posture, focused…

Large E&P Adds Second Completions Crew and Accelerates 4-Mile Lateral Program
Chord Energy extended its 2025 execution streak in 3Q25, delivering oil volumes above the midpoint of guidance while keeping E&P and other capital spending below the midpoint. The…