
Drilling & Completions | Well Cost | Quarterly / Earnings Reports | Debt | Second Quarter (2Q) Update | Financial Results | Hedging | Capital Markets | Capital Expenditure | Curtailment/Shut-In
EQT 2Q20 Results: Cuts Debt Load by $400MM, 1.0 Bcfe/d Production Curtailed

EQT Corp. reported its results for the second quarter 2020.
1.0 Bcfe/d of production Curtailed.
On May 16, 2020, EQT made the strategic decision to temporarily curtail approximately 1.4 Bcfe per day of gross production, equivalent to approximately 1.0 Bcfe per day of net production, which remained shut-in for the duration of the second quarter 2020 (the Strategic Production Curtailments). Total sales volumes decreased 24 Bcfe compared to the same quarter last year due primarily to the Strategic Production Curtailments. In addition, average realized price was 9% lower at $2.36 per Mcfe, due to lower NYMEX prices and lower liquids prices, partly offset by higher cash settled derivatives.
Second Quarter Highlights
Production, Spending & Ops- Delivered sales volumes of 346 Bcfe or 3.8 Bcfe per day, 21 Bcfe above midpoint of guidance for second quarter 2020 - this is down 10% compared to Q1 2020
- Total operating revenues of $527 million; received an average realized price of $2.36 per Mcfe, a $0.56 premium to NYMEX pricing
- Capital expenditures of $303 million, $163 million lower than the second quarter 2019 and in line with second quarter 2020 expectations
- Achieved well costs of $680 per foot in the Pennsylvania Marcellus, surpassing target well cost by $50 per foot
- Achieved an industry first 24-hour drilling record of 10,566 feet - over 2 miles per day
- Successfully issued $500 million in convertible senior notes to address near-term debt maturities
- Received $190 million in tax refunds
- Divested certain non-strategic assets for an aggregate purchase price of $125 million
- Reduced total debt by $417 million and net debt by $401 million, fully retiring the 2021 term loan
- Placed approximately $0.1 billion in surety bonds, reducing outstanding letters of credit and improving liquidity
President and CEO Toby Rice stated, "Today I am particularly excited as we have recently eclipsed our one-year anniversary at the company. Since last July, this management team has been unrelenting in our quest to deliver on our promises, which have been validated by our operational results. We've proven our thesis that a well-planned business, combined with leading technology, creates a differentiated, durable and sustainable business model. By leveraging our past experiences, we have retooled EQT into a fit-for-purpose modern shale business.
"As evident in today's announced results, our efforts have translated into a step-change in operational performance, at a faster pace than originally projected. At EQT, our mission is to be the clear operator of choice for all of our stakeholders. I am proud to say that EQT stands firmly on stable ground and we are primed to take this company to the next level. EQT is truly a rate of change story being written by a highly motivated and experienced management team, and I'm excited to continue our path towards maximizing value for all stakeholders."
Q2 2020 Financials
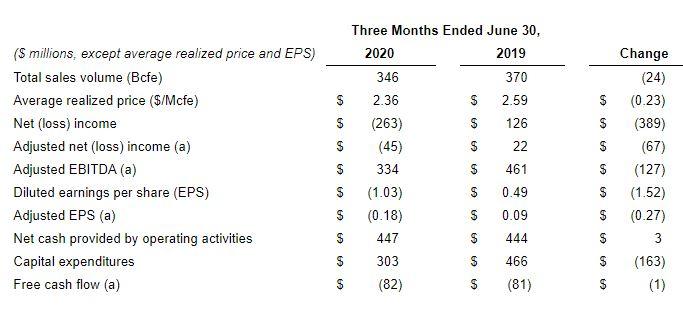
Net loss for the three months ended June 30, 2020 was $263 million, $1.03 per diluted share, compared to net income for the same period in 2019 of $126 million, $0.49 per diluted share. The decrease was attributable primarily to decreased operating revenues, the loss on sale/exchange of long-lived assets, decreased dividend and other income and increased interest expense, partly offset by a gain on investment in Equitrans Midstream Corporation (Equitrans Midstream), increased income tax benefit, decreased depreciation and depletion expense and decreased selling, general and administrative expense.
On May 16, 2020, EQT made the strategic decision to temporarily curtail approximately 1.4 Bcfe per day of gross production, equivalent to approximately 1.0 Bcfe per day of net production, which remained shut-in for the duration of the second quarter 2020 (the Strategic Production Curtailments). Total sales volumes decreased 24 Bcfe compared to the same quarter last year due primarily to the Strategic Production Curtailments. In addition, average realized price was 9% lower at $2.36 per Mcfe, due to lower NYMEX prices and lower liquids prices, partly offset by higher cash settled derivatives.
Net cash provided by operating activities increased by $3 million and free cash flow(1) decreased by $1 million compared to the same quarter last year. Despite the impact of the Strategic Production Curtailments and a 9% lower average realized price, free cash flow remained consistent with the same quarter last year due to a $163 million decrease in capital expenditures. In addition, during the second quarter of 2020, free cash flow was negatively impacted by $54 million of premiums paid for the purchase of options with the primary purpose of reducing future NYMEX based payments that could be due in 2021, 2022 and 2023 associated with the new gas gathering agreement with Equitrans Midstream.
Liquidity
As of June 30, 2020, the Company had $38 million of credit facility borrowings and $0.8 billion of letters of credit outstanding under its $2.5 billion credit facility. As of June 30, 2020, total debt was $4,620 million and net debt(1) was $4,617 million compared to $5,293 million and $5,288 million, respectively, as of December 31, 2019.
As of July 22, 2020, the Company had sufficient unused borrowing capacity under its credit facility, net of letters of credit, to satisfy any collateral requests that its counterparties would be permitted to seek. As of July 22, 2020, such amounts could be up to approximately $1.1 billion, inclusive of assurances posted of approximately $0.8 billion of letters of credit and $0.1 billion of surety bonds.
Operational Update
In early July, the Company began a moderated approached to bring back on-line production which was curtailed in May as a result of the Strategic Production Curtailments. To-date, the Company has seen no degradation to well performance and all curtailed production has been returned to sales.
During the second quarter 2020, the Company continued to realize a step-change in operational performance, driven by strong schedule design, consistent application of a proven well design, and efficient drilling and completion operations. These efficiencies required less resources necessary to deliver planned activity levels and led to improved capital deployment during the second quarter 2020, as the Company developed its Pennsylvania Marcellus wells for $680 per foot, $50 per foot below its well cost target of $730 per foot.
Since the change in management in July 2019, the Company has realized steady and consistent operational improvements. Production uptime on producing wells was over 98% during the second quarter 2020, horizontal drilling speeds have improved by 63% year-over-year and 12% quarter-over-quarter, and the utilization of next generation frac technology has driven a 20% improvement in pumping time and stages per day, since July 2019.
In June, EQT reached an industry first by drilling 10,566 feet, or more than 2-miles, in a 24-hour period, exemplifying the Company's enhanced operational performance. EQT continues to push the operational and technological boundaries to drive value creation.
The tables below reflect the Company's operational activity during the second quarter 2020 and planned activity for the third quarter and full year 2020.
|
Wells Drilled (SPUD) |
|||||||||||||||||
|
PA Marcellus |
WV Marcellus |
OH Utica |
|||||||||||||||
|
2Q20A |
3Q20E |
FY20E |
2Q20A |
3Q20E |
FY20E |
2Q20A |
3Q20E |
FY20E |
|||||||||
|
Net Wells |
21 |
17 |
69 |
3 |
15 |
24 |
2 |
- |
3 |
||||||||
|
Net Avg. Lateral |
12,980 |
11,560 |
12,560 |
13,360 |
11,530 |
11,860 |
12,150 |
- |
13,130 |
||||||||
|
Wells Horizontally Drilled |
|||||||||||||||||
|
PA Marcellus |
WV Marcellus |
OH Utica |
|||||||||||||||
|
2Q20A |
3Q20E |
FY20E |
2Q20A |
3Q20E |
FY20E |
2Q20A |
3Q20E |
FY20E |
|||||||||
|
Net Wells |
21 |
21 |
82 |
- |
7 |
9 |
4 |
1 |
8 |
||||||||
|
Net Avg. Lateral |
11,870 |
13,400 |
12,060 |
- |
9,020 |
10,030 |
12,200 |
12,030 |
12,190 |
||||||||
|
Wells Completed (Frac) |
|||||||||||||||||
|
PA Marcellus |
WV Marcellus |
OH Utica |
|||||||||||||||
|
2Q20A |
3Q20E |
FY20E |
2Q20A |
3Q20E |
FY20E |
2Q20A |
3Q20E |
FY20E |
|||||||||
|
Net Wells |
27 |
21 |
79 |
3 |
- |
3 |
10 |
- |
15 |
||||||||
|
Net Avg. Lateral |
11,100 |
12,390 |
11,730 |
4,420 |
- |
4,420 |
9,980 |
- |
10,560 |
||||||||
|
Wells Turned-in-Line (TIL) |
|||||||||||||||||
|
PA Marcellus |
WV Marcellus |
OH Utica |
|||||||||||||||
|
2Q20A |
3Q20E |
FY20E |
2Q20A |
3Q20E |
FY20E |
2Q20A |
3Q20E |
FY20E |
|||||||||
|
Net Wells |
14 |
15 |
89 |
3 |
- |
7 |
10 |
0 |
10 |
||||||||
|
Net Avg. Lateral |
10,840 |
13,540 |
11,470 |
4,420 |
- |
7,130 |
9,980 |
- |
9,980 |
||||||||
2020 Guidance
|
Production |
Q3 2020 |
Full-Year 2020 |
||
|
Total sales volume (Bcfe) |
360 - 380 |
1,450 - 1,500 |
||
|
Liquids sales volume, excluding ethane (Mbbls) |
1,700 - 1,800 |
7,600 - 7,700 |
||
|
Ethane sales volume (Mbbls) |
1,100 - 1,200 |
4,400 - 4,500 |
||
|
Total liquids sales volume (Mbbls) |
2,800 - 3,000 |
12,000 - 12,200 |
||
|
Btu uplift (MMbtu / Mcf) |
1.045 - 1.055 |
|||
|
Average differential ($ / Mcf) |
$(0.50) - |
$(0.40) - |
||
|
Resource Counts |
||||
|
Top-hole Rigs |
2 |
|||
|
Horizontal Rigs |
2 - 3 |
|||
|
Frac Crews |
2 - 3 |
|||
|
Per Unit Operating Costs ($ / Mcfe) |
||||
|
Gathering (a) |
$0.71 - $0.73 |
|||
|
Transmission (a) |
$0.35 - $0.37 |
|||
|
Processing |
$0.07 - $0.09 |
|||
|
LOE, excluding production taxes |
$0.07 - $0.09 |
|||
|
Production taxes |
$0.03 - $0.05 |
|||
|
SG&A |
$0.09 - $0.11 |
|||
|
Total per unit operating costs |
$1.32 - $1.44 |
|||
|
Adjusted interest expense (b) |
$0.16 - $0.17 |
|||
|
Financial ($ Billions) |
||||
|
Adjusted EBITDA (b) |
$1.500 - $1.600 |
|||
|
Adjusted operating cash flow (b) |
$1.350 - $1.450 |
|||
|
Capital expenditures |
$1.075 - $1.175 |
|||
|
Free cash flow (b) |
$0.250 - $0.350 |
Based on NYMEX natural gas price of $1.91 per MMbtu as of June 30,2020
Hedges (as of July 22, 2020)
The Company's total natural gas production NYMEX hedge positions are:
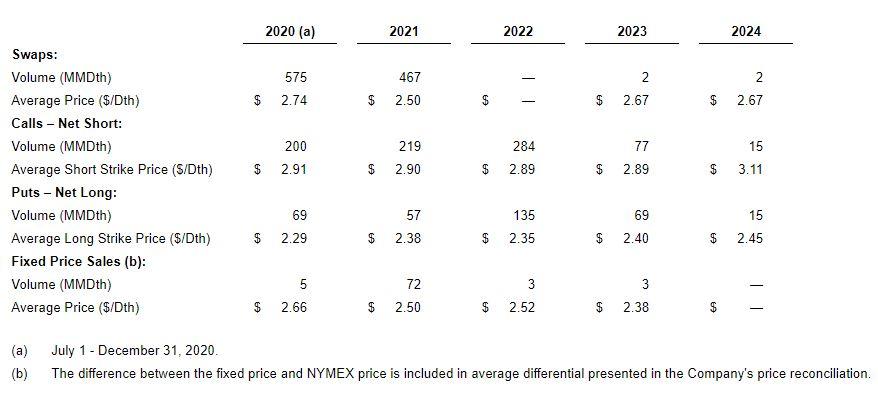
For 2020 (July 1 - December 31), 2021, 2022, 2023 and 2024, the Company has natural gas sales agreements for approximately 6 MMDth, 18 MMDth, 18 MMDth, 88 MMDth and 11 MMDth, respectively, that include average NYMEX ceiling prices of $3.60, $3.17, $3.17, $2.84 and $3.21, respectively. The Company has also entered into derivative instruments to hedge basis. The Company may use other contractual agreements from time to time to implement its commodity hedging strategy.
Related Categories :
Second Quarter (2Q) Update
More Second Quarter (2Q) Update News
-
Saturn Oil & Gas Second Quarter 2022 Results
-
Empire Petroleum Second Quarter 2022 Results
-
ProFrac Holding Corp. Second Quarter 2022 Results
-
InPlay Oil Corp. Second Quarter 2022 Results
-
Vermilion Energy Inc. Second Quarter 2022 Results
Northeast News >>>
-
Oilfield Service Report : 11 New Leads/Company Formation & Contacts

-
EQT Provides an Update on Rigs & Frac Crews, Post Recent Transaction

-
IOG forms Partnership with PE-Firm First Reverse To Fund DrillCo's -


-
Appalachia E&P Details 2025, Rig, Wells & Completion Crew Programs

-
Top E&P Outline Drilling & Frac Program For 2025; 18 Rigs & 5 Frac Crews

Northeast - Appalachia News >>>
-
Top Oilfield Company Retire Rigs & Cut Frac Horsepower Expecting Soft 2025 Market

-
Top Gas E&P To Keep 2025 Drilling & Completion Program Flat; Rigs & FRac Crews

-
This Large E&P Will Run 10 Rigs & 6 Frac Crews In 2025

-
Service Companies Talk Bleak Outlook for Remainder of 2024 -

-
Contrary to the Noise from Top Service Companies; Activity to Slow For Remainder 2024 -
