Drilling & Completions | Quarterly / Earnings Reports | Second Quarter (2Q) Update | Financial Results | Capital Markets | Drilling Activity | 2020 Guidance
Montage Resources Second Quarter 2020 Results
Montage Resources Corp. reported its Q2 2020 results.
Second Quarter 2020 Highlights:
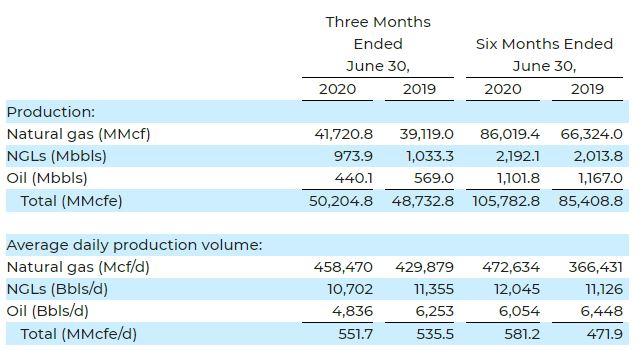
- Average net daily production was 551.7 MMcfe per day, above the midpoint of the Company's previously issued guidance range, consisting of 83% natural gas and 17% liquids
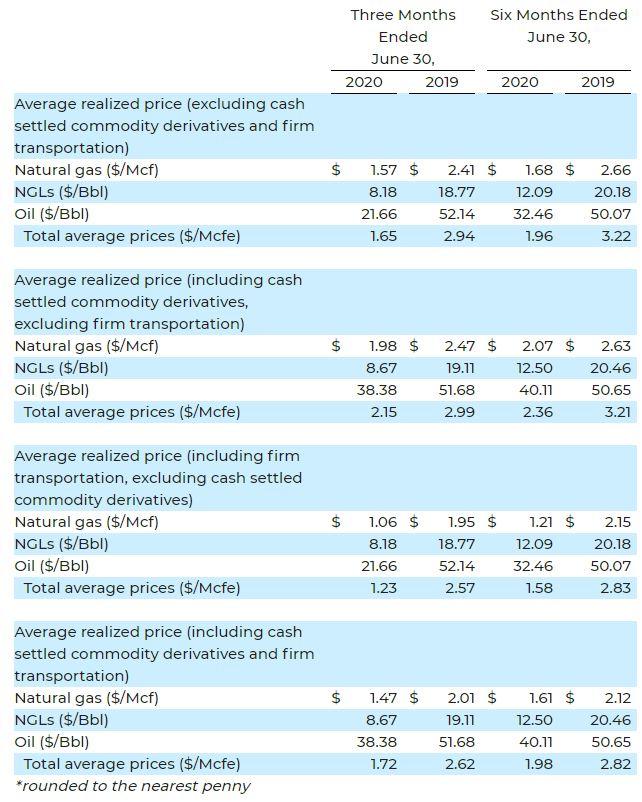
- Realized an average natural gas price, before the impact of cash settled commodity derivatives and firm transportation expenses, of $1.57 per Mcf, a $0.15 per Mcf discount to the average monthly NYMEX settled natural gas price during the quarter, better than analyst consensus expectations
- Average natural gas equivalent realized price was $2.15 per Mcfe, including cash settled commodity derivatives and excluding firm transportation expenses
- Per unit cash production costs (including lease operating, transportation, gathering and compression, production and ad valorem taxes) were $1.25 per Mcfe, better than analyst consensus expectations
- Cash general and administrative expenses1 were approximately $7.4 million, a decrease of approximately 14% compared to the first quarter of 2020 and approximately 19% compared to the second quarter of 2019 and better than analyst consensus expectations
- Capital spending for the quarter was $29.1 million, approximately 20% better than analyst consensus expectations
- Operational efficiency achievements yielded a Company record average number of completion stages per day for the quarter at 10, a Company record number of completion stages on a single pad at 11.5, and a Company record number of completion stages in one day at 15. Recent normalized well costs of approximately $808 per foot are below current type curve estimates of approximately $825 per foot in Utica Dry Gas area
- Subsequent to the end of the second quarter 2020, the Company announced a non-binding letter of intent to sell its non-core wellhead gathering infrastructure
John Reinhart, President and CEO, commented on the Company's operational and financial results, "This was another solid earnings report which illustrated our consistent focus on execution and efficiency. The continued outperformance of our wells along with our operating cadence, has allowed us to maintain our full year outlook on production expectations, despite the meaningful curtailment of production during the second quarter. The Company's swift response to market conditions early in the year with the adjustment in our development plan towards increased dry gas production allows us to capture the benefits of the improving natural gas macro conditions during the second half of 2020 and 2021. Our strong operational performance driven by our robust planning process has allowed the Company to realize additional savings on our all-in drilling and completion costs from our initial 2020 plan. Our most recent dry gas Utica pad achieved costs of approximately $808 per foot when normalized to a 13,000 foot lateral length, and the Company set new internal records for completions stages, averaging 11.5 stages per day on our most recent pad and setting a single day record of 15 stages in one day. Despite a significant amount of commodity price volatility during the second quarter 2020, we have again been able to deliver a strong natural gas realized price with our ability to optimize this production to buyers needing to fill unutilized capacity and continue to view this opportunity as a competitive advantage, given the highly uncommitted nature and flexibility of our production base. Our ongoing financial discipline has strengthened our balance sheet and liquidity position, which would be further enhanced by the closing of our recently announced non-binding letter of intent to sell our non-core gathering assets in Ohio. Our proven track record of execution throughout 2019 and into 2020 has solidified our position not just as a cost and efficiency leader, but also as a team with a winning strategy that remains well positioned to leverage our experience to achieve our goals of free cash flow generation and debt reduction."
Operational Discussion
The Company's net production for the three and six months ended June 30, 2020 and 2019 is set forth in the following table:
Financial Discussion
Revenue for the three months ended June 30, 2020 totaled $90.7 million, compared to $155.5 million for the three months ended June 30, 2019. Adjusted Revenue2, which includes the impact of cash settled commodity derivatives and excludes brokered natural gas and marketing revenue and other revenue, totaled $107.9 million for the three months ended June 30, 2020 compared to $145.9 million for the three months ended June 30, 2019. Net Loss for the three months ended June 30, 2020 was ($68.9) million, or $(1.92) per share, compared to Net Income of $27.5 million, or $0.77 per share, for the three months ended June 30, 2019. Adjusted Net Income (Loss)2 for the three months ended June 30, 2020 was $(20.6) million, or $(0.57) per share, compared to $14.6 million, or $0.41 per share for the three months ended June 30, 2019. Adjusted EBITDAX2 was $37.5 million for the three months ended June 30, 2020 compared to $70.9 million for the three months ended June 30, 2019.
Average realized price calculations for the three and six months ended June 30, 2020 and 2019 are set forth in the table below:
The Company's cash production costs (which include lease operating, transportation, gathering and compression, production and ad valorem taxes) are shown in the table below. Per unit cash production costs, which include $0.42 per Mcfe of firm transportation expense, were $1.25 per Mcfe for the second quarter of 2020, a decrease of approximately 7% compared to the second quarter of 2019.
General and administrative expense (including one-time merger-related expenses and severance) was $11.6 million and $13.6 million for the three months ended June 30, 2020 and 2019, respectively, and is shown in the table below. Cash general and administrative expense3 (excluding merger-related expenses, severance and stock-based compensation expense) was $7.4 million and $9.1 million for the three months ended June 30, 2020 and 2019, respectively. General and administrative expense per Mcfe (including one-time merger-related expenses and severance) was $0.23 in the three months ended June 30, 2020 compared to $0.28 in the three months ended June 30, 2019. Cash general and administrative expense3 per Mcfe (excluding merger-related expenses, severance and stock-based compensation expense) decreased approximately 26% to $0.14 in the three months ended June 30, 2020 compared to $0.19 in the three months ended June 30, 2019.
Capital Expenditures
Second quarter 2020 capital expenditures were $29.1 million, including $27.6 million for drilling and completions, $1.4 million for land-related expenditures and $0.1 million for other expenditures.
During the second quarter of 2020, the Company commenced drilling 5 gross (3.4 net) operated wells, commenced completions of 7 gross (5.4 net) operated wells and turned to sales 7 gross (6.1 net) operated wells.
Financial Position and Liquidity
As of June 30, 2020, the Company's liquidity was $295.0 million, consisting of $9.2 million in cash and cash equivalents and $285.8 million in available borrowing capacity under the Company's revolving credit facility (after giving effect to outstanding letters of credit issued by the Company of $29.2 million and $160.0 million in outstanding borrowings).
Michael Hodges, Executive Vice President and Chief Financial Officer, commented, "We are very proud of the results in the second quarter of 2020 that have allowed the Company to solidify its financial strength despite a volatile commodity price environment. We believe that the flexibility of our portfolio and our continued improvement in operating costs will allow us to navigate the current operating environment without adding stress to our balance sheet. Finally, our strong hedge book remains a key element of our strategy, with approximately 70% of our natural gas hedged and approximately 60% of our oil hedged (based on our revised production profile) for 2020, providing us with a high level of cash flow certainty and confidence in the long-term health of our balance sheet."
Guidance
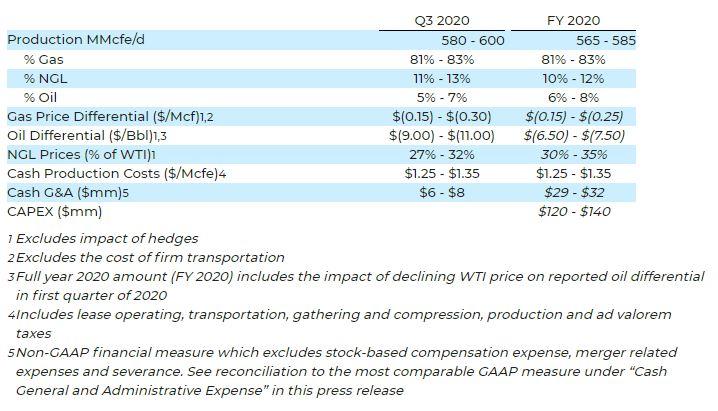
The Company is providing its initial third quarter and updated full year 2020 guidance as set forth in the table below (updated guidance in italics).
Related Categories :
Second Quarter (2Q) Update
More Second Quarter (2Q) Update News
-
SM Energy Hits Record Output; Driven by Uinta
-
Expand Energy Talks, Wells, Frac Crews, Production For 2H-2025 -

-
Comstock Rides Higher Gas Prices, Operational Momentum in Q2 2025
-
A Quarter of Quiet Strength: CNX’s Patient Ascent in Appalachia -

-
Liberty Energy: Navigating the Frac Downturn with Efficiency, Innovation, and Strategic Focus -

Northeast News >>>
-
Why Surface-Only Inventory Predictions Are a Fool’s Errand

-
Silent Surge: Operator Tops Antero in Utica Well Performance

-
Gas Players : A Comparative Analsysis

-
Expand Energy Talks, Wells, Frac Crews, Production For 2H-2025 -


-
A Quarter of Quiet Strength: CNX’s Patient Ascent in Appalachia -


Northeast - Appalachia News >>>
-
Liberty Energy: Navigating the Frac Downturn with Efficiency, Innovation, and Strategic Focus -


-
Baker Hughes Solid Y/Y Performance Amidst US Frac Market Slowdown -


-
Halliburton Warns of Deepening U.S. Frac Slowdown -


-
EQT's Completion Efficiency Drove Outperformance In 2Q

-
Oilfield Service Report : 13 New Leads/Company Formation & Contacts YTD


