
Drilling & Completions | Quarterly / Earnings Reports | Fourth Quarter (4Q) Update | Financial Results | Capital Markets | Capital Expenditure
Oasis Petroleum Fourth Quarter, Full Year 2021 Results

Oasis Petroleum Inc. announced financial and operating results for the quarter and year ending December 31, 2021. Fourth quarter and year end results are consistent with the update released on February 9, 2022.
4Q21 Operational and Financial Highlights:
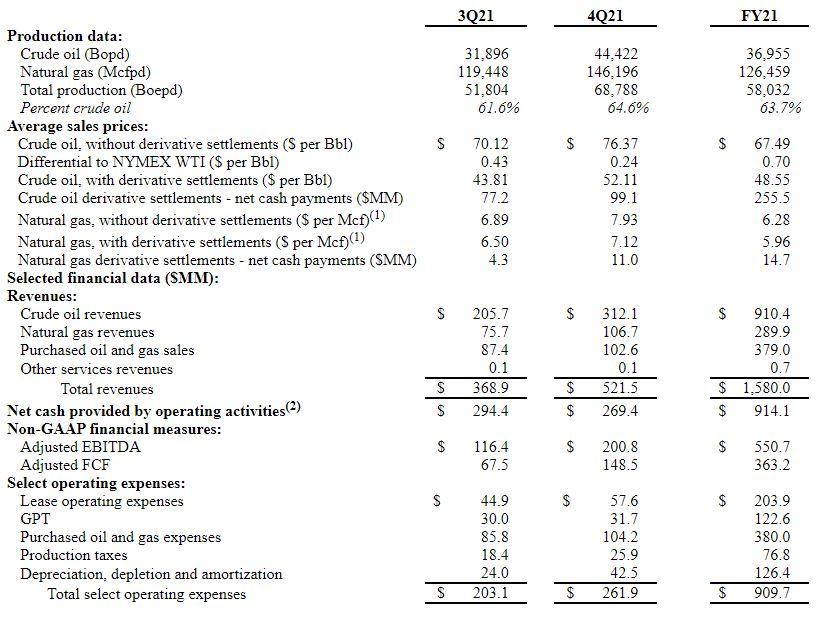
- Produced 68.8 MBoepd in 4Q21 with oil volumes of 44.4 MBopd;
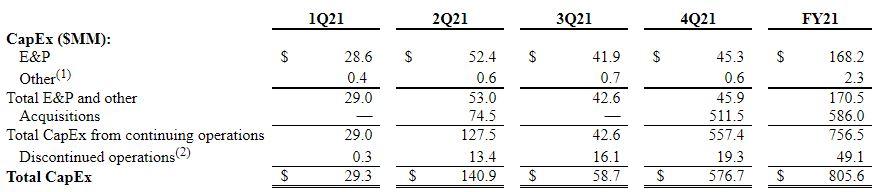
- E&P CapEx was $45.3MM in 4Q21 and $168.2MM in FY21;
- Net cash provided by operating activities was $269.4MM, net income was $225.9MM and net income from continuing operations was $188.2MM;
- Adjusted EBITDA from continuing operations(1) was $200.8MM and Adjusted Free Cash Flow(1) was $148.5MM;
- Received distribution of $19.0MM from OMP on November 29th ;
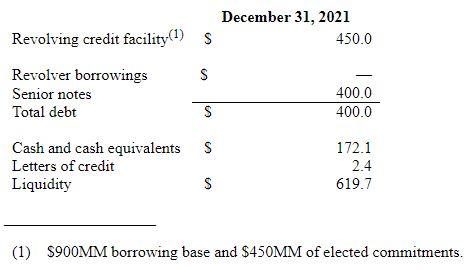
- Pro forma net debt was $67.9MM as of December 31, 2021, including $160.0MM of cash received for the OMP merger with Crestwood, which closed on February 1, 2022. No amounts were drawn under the revolving credit facility ($900MM borrowing base; $450MM of elected commitments);
- Increased base dividend 17% to $0.585/share ($2.34/share annualized) on February 9, 2022. The base dividend will be paid on March 4, 2022 to shareholders of record as of February 21, 2022;
- Completed $100MM share repurchase program.
Results Summary
The Company recorded an income tax benefit from continuing operations of $1.0MM in FY21, resulting in an annual effective tax benefit of (0.3)%.
For 4Q21 and FY21, the Company reported net income from continuing operations of $188.2MM and $189.0MM, respectively, or $8.96 and $9.15 per diluted share, respectively. Excluding certain non-cash items and their tax effect, adjusted net income attributable to Oasis from continuing operations (non-GAAP) was $89.3MM, or $4.25 per diluted share, in 4Q21 and $196.4MM, or $9.52 per diluted share, in FY21.
Capital Expenditures
The following table presents the Company's total capital expenditures ("CapEx") by category for the periods presented:
Balance Sheet and Liquidity
The following table presents key balance sheet statistics and liquidity metrics from continuing operations as of December 31, 2021 (in millions):
Related Categories :
Fourth Quarter (4Q) Update
More Fourth Quarter (4Q) Update News
-
Apa Corp : Doing More With Less
-
Permian Resources to Grow Production 6% in 2026
-
Endeavor Talks 2023 Development Program; Rigs, Frac Crews -

-
Crescent Energy 4Q, Full Year 2022 Results; Maintenance Capital for 2023
-
W&T Offshore Fourth Quarter, Full Year 2022 Results; 2023 Guidance
Permian News >>>
-
Why $90 Oil Isn’t Bringing Back the Rigs -

-
These Three Companies Will Increase Drilling & Completion Over The Next 3 Year -

-
Q1 A&D Transactions Jump to $30B , While Deal Flow Was Down 40%

-
Wright to U.S. Oil Industry: The Price Signal Is Telling You to Drill

-
Apa Corp : Doing More With Less

Rockies News >>>
-
Permian Resources to Grow Production 6% in 2026

-
Battalion Oil Closes ~$60M West Quito Draw Asset Sale

-
Deal Rumor: ConocoPhillips Exploring $2B Permian Asset Sale

-
This Operator Will Chop it's 2026 Rig Count From 34 to 24 -

-
A Quiet Capital Pattern Is Forming in North American Upstream — and Almost No One Is Talking About It -
