
Exclusives / Features
Today in Charts: Q1'2020 Appalachian E&P Score Card; Liquidity, Capex, Free Cash Flow

Today we are featuring charts with the latest 2020 data from E&Ps that have detailed their Q1 results.
Various data points are featured including revised 2020 spending / completion comparisons, impairment charges, production data, and more.
Appalachian Operators Score Card
We outlined the latest data points from several operators in the region:
Enlarge Image
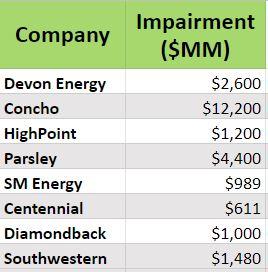
Impairment Charges
More Exclusives / Features News

Why $90 Oil Isn’t Bringing Back the Rigs
Higher oil prices are not translating cleanly into a drilling response across U.S. shale, and company disclosures are starting to show why. The issue is not simply capital…

These Three Companies Will Increase Drilling & Completion Over The Next 3 Year
In the span of fifteen months, three Japanese energy companies committed more than $10.3 billion to U.S. natural gas production assets — a buying spree that has transferred…

Q1 A&D Transactions Jump to $30B , While Deal Flow Was Down 40%
The first quarter of 2026 has officially defined the "Barbell Era" of American oil and gas. While the total number of deals plummeted by 46% YoY (dropping to…

Venezuela: Rebuild Potential vs. Stop/Start Reality — What It Means for International OFS
Venezuela: Rebuild Potential vs. Stop/Start Reality — What It Means for International OFS According to Reuters, Venezuela’s oil sector remains a high-potential but fragile opportunity: it holds massive…

A Quiet Capital Pattern Is Forming in North American Upstream — and Almost No One Is Talking About It
A handful of recent transactions and capital raises point to a subtle pattern in North American upstream—one that is easy to miss because each event, on its own,…
Northeast News
Why $90 Oil Isn’t Bringing Back the Rigs
Higher oil prices are not translating cleanly into a drilling response across U.S. shale, and company disclosures are starting to show why. The issue is not simply capital…
These Three Companies Will Increase Drilling & Completion Over The Next 3 Year
In the span of fifteen months, three Japanese energy companies committed more than $10.3 billion to U.S. natural gas production assets — a buying spree that has transferred…
Q1 A&D Transactions Jump to $30B , While Deal Flow Was Down 40%
The first quarter of 2026 has officially defined the "Barbell Era" of American oil and gas. While the total number of deals plummeted by 46% YoY (dropping to…

Wright to U.S. Oil Industry: The Price Signal Is Telling You to Drill
Energy Secretary Chris Wright stood in front of the largest gathering of oil executives in the world this morning and delivered a message that was equal parts market…

Ascent Resources 2026: A Quiet Growth Story for Oilfield Services
Ascent Resources may not be making headlines with rig additions or dramatic well count increases, but a closer read of their March 2026 investor presentation — compared against…
Northeast - Appalachia News

Apa Corp : Doing More With Less
APA's 2025 narrative was one of operational surprise. The company came in beating production guidance every single quarter while spending below plan, capturing over $300MM in cost savings…

Permian Resources to Grow Production 6% in 2026
Permian Resources exited 2025 as the largest pure-play Delaware Basin operator with ~480,000 net acres and >105,000 net royalty acres. The company averaged 392.6 MBoe/d in 2025, including…

Battalion Oil Closes ~$60M West Quito Draw Asset Sale
Battalion Oil Corporation has closed the sale of its West Quito Draw assets in the Southern Delaware Basin to MCM Delaware Resources LLC, a subsidiary of MCM Energy…

Infinity Closes $1.2B Utica Upstream & Midstream Deal
Infinity Natural Resources has completed its $1.2 billion acquisition of upstream and midstream assets in the Ohio Utica Shale from Antero Resources and Antero Midstream, according to company disclosures…

Deal Rumor: ConocoPhillips Exploring $2B Permian Asset Sale
ConocoPhillips is reportedly exploring the potential sale of certain Permian Basin assets in a transaction valued at approximately $2 billion, according to Reuters, citing sources familiar with the…