

Quarterly / Earnings Reports | Second Quarter (2Q) Update | Production Rates | Forecast - Production | Hedging | Capital Markets | Capital Expenditure
Breitburn's Production Safely Hedged into 2017
 Print
|
Print
|

Breitburn Energy Partners LP has announced financial and operating results for the second quarter 2015, and provided second half 2015 guidance.
Highlights
- Closed the $1 billion strategic investment led by EIG Global Energy Partners on April 8th, resulting in approximately $500 million of current available liquidity.
- Reported total production of 5.0 MMBoe, in-line with Breitburn's 2015 guidance.
- Based on Breitburn's current commodity hedge portfolio and assuming second half 2015 guidance production rate as set forth below, Breitburn's total production is 77% hedged for the remainder of 2015, 65% in 2016, and 41% in 2017 at attractive prices. The mark-to-market value of Breitburn's commodity hedge portfolio was approximately $544 million as of June 30th and approximately $670 million as of July 31st.
Second Quarter 2015 Operating and Financial Results Compared to First Quarter 2015
- strong>Total production was 5,015 MBoe in the second quarter of 2015 compared to 5,051 MBoe in the first quarter of 2015. Average daily production was 55.1 MBoe/day in the second quarter of 2015 compared to 56.1 MBoe/day in the first quarter of 2015.
- Oil production decreased to 2,822 MBbl compared to 2,890 MBbl in the first quarter of 2015.
- NGL production increased to 483 MBbl compared to 459 MBbl in the first quarter of 2015.
- Natural gas production increased to 10,264 MMcf compared to 10,211 MMcf in the first quarter of 2015.
- Losses on commodity derivative instruments were $93.4 million in the second quarter of 2015 compared to gains of $137.2 million in the first quarter of 2015, primarily due to an increase in oil and natural gas futures prices during the second quarter of 2015. Derivative instrument settlement receipts were $100.6 million in the second quarter of 2015 compared to receipts of $126.4 million in the first quarter of 2015, primarily due to higher oil prices.
- NYMEX WTI oil spot prices averaged $57.85 per Bbl and Brent oil spot prices averaged $61.65 per Bbl in the second quarter of 2015 compared to $48.49 per Bbl and $53.98 per Bbl, respectively, in the first quarter of 2015. Henry Hub natural gas spot prices averaged $2.75 per Mcf in the second quarter of 2015 compared to $2.90 per Mcf in the first quarter of 2015.
- Average realized crude oil, NGL and natural gas prices, excluding the effects of commodity derivative settlements, were $53.29 per Bbl, $18.35 per Bbl and $2.57 per Mcf, respectively, in the second quarter of 2015 compared to $43.62 per Bbl, $16.54 per Bbl and $3.05 per Mcf, respectively, in the first quarter of 2015.
- Oil, NGL and natural gas capital expenditures were $58 million in the second quarter of 2015, compared to $73 million in the first quarter of 2015.
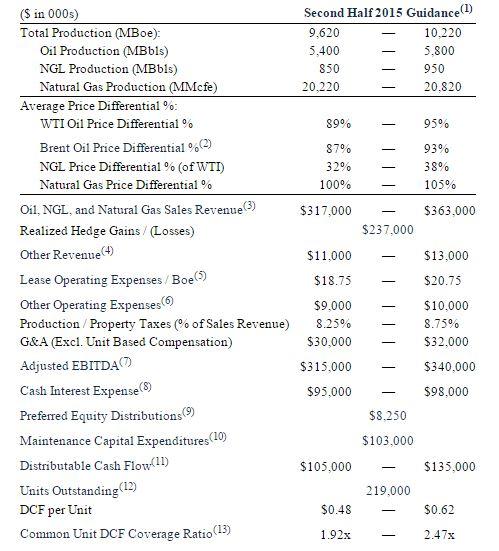
Second Half 2015 Guidance (Assuming No Acquisitions)
Management Commentary
Halbert S. Washburn, Breitburn's Chief Executive Officer, said: "We are very pleased to report another solid quarter with production, cost reductions, and Adjusted EBITDA in-line with our guidance for the first half of the year. We have completed the integration of the QR Energy assets and our diverse portfolio continues to perform as expected in this challenging environment. Earlier this year, we announced a number of steps to address what we thought could be an extended period of weak commodity pricing. Those steps included dramatically reducing our capital budget, implementing an aggressive program to reduce operating costs and completing a significant workforce reduction plan. In addition, in April we raised almost $1 billion in external capital and reset our borrowing base to $1.8 billion, without a scheduled redetermination until April of 2016. We also reset our common unit distribution to $0.50 per unit. As a result of these actions, we currently have approximately $500 million of available liquidity under our credit facility, are on track to reduce bank debt throughout the year and have an excellent distribution coverage ratio of 2.16 times this quarter.
In addition, we continue to evaluate the most attractive alternatives for maximizing the value of our substantial acreage position in the Midland Basin. With over 22,000 gross surface acres and approximately 360 net identified locations, we have the ability to add meaningful production and reserves to our base business over the course of the next few years. This acreage provides us with significant strategic and operating flexibility particularly in the current commodity price environment."
More Hedging News

Earthstone Energy Talks 2022 Results; Plans Five-Rig Program for 2023
Earthstone Energy, Inc. announced financial and operating results for the quarter and year ended December 31, 2022. 2023 Guidance The Company reaffirms its guidance released on February 16,…

Vermilion Energy Inc. Second Quarter 2022 Results
Vermilion Energy Inc. reported its second quarter 2022 results. Highlights: Q2 2022 fund flows from operations (“FFO”)(1) was $453 million ($2.75/basic share)(2) and free cash flow (“FCF”)(3) was…

Crescent Energy Co. Second Quarter 2022 Results
Crescent Energy Co. announced financial and operating results for the second quarter of 2022 and a quarterly cash dividend of $0.17 per share. Second Quarter 2022 Highlights: Produced…

Murphy Oil Second Quarter 2022 Results
Murphy Oil Corp. announced its financial and operating results for the second quarter ended June 30, 2022. Murphy reported net income attributable to Murphy of $351 million, or…

Silverbow Resources Second Quarter 2022 Results
SilverBow Resources, Inc. announced operating and financial results for the second quarter of 2022. Highlights include: Reported net production of 238 million cubic feet of natural gas equivalent…
North America News

Western Canada Upstream M&A: Q1 2026 Transaction Report
Western Canadian M&A activity in Q1 2026 was characterized by a 87% decrease in total deal value compared to Q1 2025, totaling $0.8 billion C$. However, transaction volume…

Whitecap Details 2026 Duvernay & Montney Program
Whitecap Resources reported strong third quarter 2025 operating and financial results, marking its first full quarter following the strategic combination with Veren that closed on May 12, 2025.…

ARC Resources: Lower 2026 Capex, Higher Volumes
ARC Resources used its third quarter update to reinforce a familiar message to Canadian E&P executives: disciplined capital, structurally better market access, and a growing shareholder return program…

Baytex 2026 Development Plans
Baytex’s 2026 development plan reflects a post–Eagle Ford sale capital program and a sharpened focus on its core Canadian assets. The Company approved 2026 exploration and development expenditures…

Tourmaline: 2026 Capital Program Locked In at $2.9B
Tourmaline’s 2026 exploration and production (EP) program is set at $2.9 billion and targets average production of 690,000–710,000 boepd, with the company maintaining the multi-year EP Plan released…