
Drilling & Completions | Well Cost | Quarterly / Earnings Reports | First Quarter (1Q) Update | Capital Markets | Capital Expenditure | Drilling Activity
Callon's Drilling Ops Up Over +30% YOY in Q1; Spending, Production Also Jumps

Callon Petroleum Co. reported its Q1 2019 results. Highlights from its report and presentation follow.
Q1 Summary
 - Well Activity (gross): Drilled 21 wells / TIL 13 wells in Q1 - up +31% and down -13% YOY, respectively
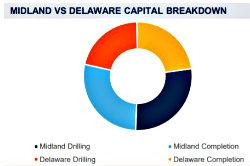
- Delaware Basin: 10 gross (7.2 net)
- Midland Basin: 11 gross (9.2 net)
- Rigs: 6 total rigs running - up +20% YOY - however the company plans to reduce it to four rigs running in 2H19
- Q1 D&C Spending: $155.2 million - up +47% YOY
- Q1 Production: Total equivalent production averaged 40.3 MBOEPD - up +52% from Q1 2018
- Oil cut represented 79% of total production
Improved Completion Efficiencies
- Improved completion efficiency, measured in stages per day, by more than 25% compared to the same period in 2018
- Reduced average drilling and completion costs by 15% sequentially, resulting in an average cost per lateral foot below $1,000
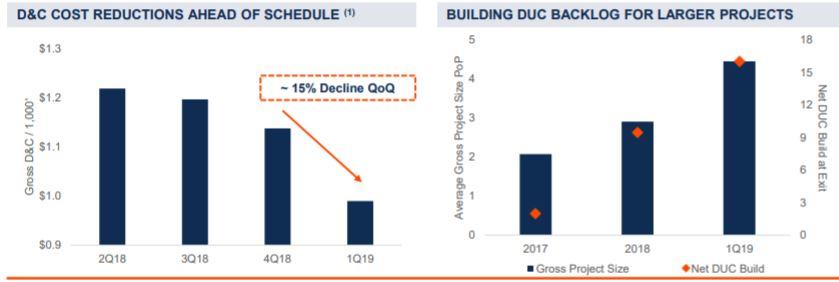
CEO Joe Gatto commented: "We are ahead of our plan to build out an inventory of drilled, uncompleted wells to extend our usage of a larger pad development model, applying this concept to the Delaware Basin as we continue to build upon our success in the Midland Basin. Capitalizing on the efficiencies of larger development, we delivered a sequential decrease in average drilling and completion cost per lateral foot of 15% in the first quarter. Our drilling plan is quickly progressing to the point where we will decrease to four drilling rigs and start larger Delaware Basin pad completions towards the end of the second quarter."
Ops
Midland Basin
We brought 11 gross (9.2 net) wells on production in the Midland Basin during the first quarter with the majority of activity coming from our Monarch area. Our Middle Spraberry well, the Kendra Amanda PSA 33 MS, an 8,000 foot lateral, which was completed as part of a multi-well pad project, has achieved a 30-day average production rate of approximately 110 Boe per thousand lateral feet (90% oil) and continues to perform well.
Near the end of the quarter, in the WildHorse area in Howard County, we began flowback on a five-well pad that employed half section development in the Wolfcamp A. While not all wells have reached 30 days of production, the combined five-well average for current accumulated production includes an average peak rate of over 1,500 Boe per day (92% oil) or approximately 175 Boe per thousand lateral feet.
The previously disclosed outage at a third party gas processing facility in Martin County has been resolved and we currently do not forecast any impact to second quarter production.
Delaware Basin
At our Spur area in Ward County, we placed on production the Wally World A1 01LA and A2 02LA, both Lower Wolfcamp A wells, which together have achieved cumulative production of over 100,000 Boe (84% oil) during their first 30 days of production. Recently, a two-well pad featuring 2nd Bone Spring shale and Lower Wolfcamp A co-development at Spur, was completed and placed on production. Both wells have performed as expected during their limited time on production and we will continue to monitor and compare to third party offsets in the area.
The field optimization project that was initiated during the first quarter of 2019 is progressing and is expected to be completed near the end of the second quarter. We currently expect deferred production related to wells shut in for repairs to average 1,600 Boe per day (79% oil) for the second quarter.
Capital Expenditures
For the three months ended March 31, 2019, we incurred $155.2 million in operational capital expenditures (including other items) on an accrual basis as compared to $141.2 million in the fourth quarter of 2018. Total capital expenditures, inclusive of capitalized expenses, are detailed below on an accrual and cash basis (in thousands):
Related Categories :
First Quarter (1Q) Update
More First Quarter (1Q) Update News
-
Gulfport Touts Super Long Lateral and Strategic Pivot To Gas Asset
-
Civitas Provides Update on Current Rigs & Frac Crews -

-
Large Permian E&P Talks 1Q'24; 282 Wells Planned for 2024 -
-
CNX Resources Cut Frac Activity 50%, Talks 1st Quarter Activity -
-
Large E&P To Defer Completion Activity, Build DUCs -
Permian News >>>
-
Why Surface-Only Inventory Predictions Are a Fool’s Errand

-
Occidental Eyes $10 Billion OxyChem Sale Amid Debt and Capital Discipline Push -

-
Permian Gas Gets New Highway: Transwestern’s 1.5 Bcf/d Desert Southwest Expansion -

-
WaterBridge Infrastructure Brings Delaware Basin Water Model to Wall Street -

-
OPEC+ Nudges Supply Higher: Why This Weekend’s Hike Echoes 2020—But Isn’t 2020

Permian - Delaware Basin News >>>
-
SM Energy Hits Record Output; Driven by Uinta

-
The Permian Play: How ExxonMobil Is Rewriting the Shale Narrative -

-
Large Cap E&P To Reduce Drilling & Completion Activity in 2026 -

-
$2.4B Deal Gives MPLX Sour Gas Edge in Permian -

-
Liberty Energy: Navigating the Frac Downturn with Efficiency, Innovation, and Strategic Focus -
