
Drilling / Well Results | Quarterly / Earnings Reports | Second Quarter (2Q) Update | Well Spacing
Jagged Peak Touts Impressive Delaware Basin Well Results, Spacing Tests

Jagged Peak Energy Inc. reported its Q2 2019 results. Here are the highlights from its report and conference call:
Impressive Delaware Basin Well Results, Spacing Tests
Well Results
The company commented: "In the first half of the year, we had brought online 2 delineation wells, the first of which was placed in the west central area of Big Tex, targeting the Wolfcamp A formation, in a hydrated geologic fairway that was then formed by the 3D seismic and other geologic data acquired at the end of last year. The second of these wells was placed in the southeast corner of our acreage, targeting the Woodford formation. As you can see on the slide, both wells have had encouraging early results."
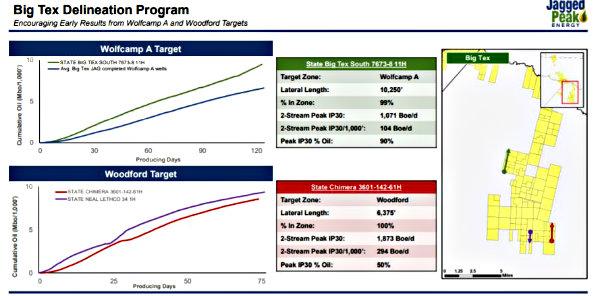
The first well, the State Big Tex 7673-8-11-H, targeted the Wolfcamp A and was placed 99% in zone with a 10,250-foot lateral. This well’s early time cumulative production has been strong, outperforming our average historical Big Tex results by a wide margin. The well was recently put on electrical submersible pump and has the most recent 7-day average oil rate of 1,077 barrels per day, notable as the well has been on production for over 130 days.
The second well in the slide is the Chimera well, which targeted the Woodford formation. The Chimera well is a 6,400-foot lateral placed entirely in zone, with encouraging early time production, which surpassed the normalized IP rate of the company’s first Woodford well. Though it is too early for an assessment of overall well performance or even a 90-day IP rate, the wells normalized peak IP30 of 294 BOE per day per 1,000 lateral feet is certainly impressive. We will continue to monitor the results of these wells and look forward to the results from the two remaining hydrated Big Tex wells targeting the Wolfcamp A, which are expected to come online in the third quarter.
Well Spacing
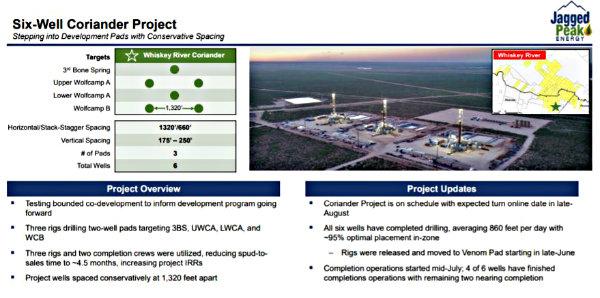
As you can see in the gun barrel slide on the top left corner of the slide, we have planned these wells to be spaced quite conservatively with lateral spacing of approximately 1,320 feet apart. And this is our first test of a bounded multi-horizon well package. We wanted to make sure we were conservatively stepping into these development projects and not over capitalizing the rock. Our next two development scale projects, the Venom and UTL projects will both utilize 880-foot spacing which we would consider a more realistic go-forward development spacing and is equivalent to what our inventory count is based on.
Well Cost Reduction
Yes. This is Craig Walters. So yes, on the DC&E front, we’ve made great strides so far in 2019. As you recall, our average last year on a per lateral foot basis of drill complete, plus the equip or the facilities, was $1,450 per foot. We are currently a year-to-date average $1,270. The last quarter, it was $1,250 on a per foot basis. So as we look at the Coriander and now Venom, we are realizing some incremental efficiencies definitely on the drilling side. It’s been very beneficial for us to have multiple rigs sitting on the same pad to learn kind of how the rock
Original Release:
Jim Kleckner, President and Chief Executive Officer, commented, "I am pleased with our Company's execution and performance through the first half of the year, with our DC&E costs down significantly from 2018. We continue to be intently focused on creating additional value through further reductions of these DC&E costs and preserving our high operating margins. Leveraging these efficiency gains will remain an important part of our business as we move to development projects in 2019 and 2020. During the quarter, we started operations on the six-well Coriander pad. The wells have been drilled and the completions are progressing on schedule to deliver first production in the next few weeks. Also during the quarter, we turned online two wells in the Big Tex area and have seen encouraging initial results. While it's too early to make a full assessment of these results, we remain cautiously optimistic on the future optionality of our Big Tex area."
Second Quarter Results
During the second quarter of 2019, the Company turned online 11 gross operated wells and reported average daily oil production for the quarter of 29.1 MBbls per day, at the upper end of the Company's previously announced guidance range of 27.8 - 29.2 MBbls per day. Total equivalent production averaged 38.3 MBoe per day for the second quarter, slightly above the upper end of the Company's previously announced guidance range of 36.6 - 38.0 MBoe per day. Second quarter production mix was comprised of 76% oil, 13% NGLs, and 11% natural gas, and is essentially unchanged from the prior quarter.
For the second quarter of 2019, the Company reported net income of $41.9 million, or $0.20 per diluted common share. Net income for the second quarter of 2018 was $45.1 million, or $0.21 per diluted common share. Adjusted net income (a non-GAAP measure) for the second quarter of 2019, was $21.3 million, or $0.10 per diluted common share, compared to $43.3 million, or $0.20 per diluted common share for the same period in 2018. Adjusted net income (a non-GAAP measure) eliminates certain non-cash and non-recurring items such as certain equity-based compensation, non-cash mark-to-market gains or losses on derivatives and impairment expense, further adjusted for any associated changes in estimated income tax expense. Adjusted EBITDAX (a non-GAAP measure) for the second quarter of 2019 was $101.7 million, a decrease of $16.9 million from the second quarter of 2018.
Please reference the reconciliations of these non-GAAP measures to the most directly comparable GAAP measures at the end of this release.
Revenue for the second quarter of 2019 was $146.8 million, compared to $158.7 million in the second quarter of 2018. The decrease in revenue for the second quarter of 2019 compared to the same period in 2018 was primarily due to a 16% decrease in unhedged realized pricing on a per Boe basis. Natural gas pricing during the quarter was weak as daily spot pricing at Waha, the Company's primary pricing point, averaged approximately $0.01/Mcf for the quarter. After differentials, processing, and transportation fees were applied, the net realized price for natural gas sales for the quarter was negative $0.87 per Mcf. Despite negative realized pricing for natural gas, the Company continued to gather and process its gas to capture economics from NGL volumes and minimize flare volumes. Average realized prices for the second quarter of 2019 are included in the table below.
|
Three Months Ended June 30, 2019 |
|||||||
|
Before the Effects of |
After the Effects of |
||||||
|
Oil ($/Bbl) |
$ |
54.98 |
$ |
51.70 |
|||
|
NGL ($/Bbl) |
$ |
7.15 |
$ |
7.15 |
|||
|
Gas ($/Mcf) |
$ |
(0.87) |
$ |
(0.87) |
|||
|
Boe ($/Boe) |
$ |
42.15 |
$ |
39.65 |
|||
The table below provides a summary of the Company's second quarter and first half 2019 actual results in comparison to its previously provided guidance ranges.
|
Three Months Ended June 30, 2019 |
|||
|
Actual |
Guidance (1) |
||
|
Production |
|||
|
Average daily equivalent production (MBoe/d) |
38.3 |
36.6 - 38.0 |
|
|
Average daily oil production (MBbl/d) |
29.1 |
27.8 - 29.2 |
|
|
Six Months Ended |
Full-Year 2019 |
||
|
Actual |
Guidance (1) |
||
|
Production |
|||
|
Average daily equivalent production (MBoe/d) |
37.5 |
38.3 - 41.3 |
|
|
Average daily oil production (MBbl/d) |
28.6 |
29.2 - 31.2 |
|
|
Income Statement |
|||
|
Lease operating expense ($/Boe) |
$4.31 |
$3.65 - $4.15 |
|
|
General and administrative (before equity-based compensation) ($MM) (Non-GAAP) |
$19.5 |
$46 - $50 |
|
|
Production and ad valorem taxes (% of revenue) |
7.5% |
6.0% - 7.0% |
|
|
Capital Expenditures |
|||
|
Drilling and completion ($MM) |
$288.7 |
$580 - $630 |
|
|
Infrastructure and other ($MM) |
$21.2 |
$25 - $35 |
|
|
Total development capital ($MM) |
$309.8 |
$605 - $665 |
|
|
Operated Activity |
|||
|
Gross horizontal wells brought online |
23 |
52 - 56 |
|
|
Note: Totals may not add due to rounding. |
|
(1) Guidance as provided in the Company's first quarter earnings and operational update press release on May 9, 2019. |
The Company's lease operating expense ("LOE") per Boe for the quarter trended above the upper end of the annual guided range, primarily due to increased costs associated with artificial lift, including additional workover expenses and electric power. The Company now expects many of these increased costs to persist throughout the remainder of the year and has revised its guidance range, which are reflected in the "Updated 2019 Capital, Production, and Operating Guidance" section below.
Capital expenditures for DC&E activities were $152.0 million for the three months ended June 30, 2019. Activity during the quarter included drilling 13 and completing 11 gross (10.4 net) operated wells. A portion of the capital spent during the second quarter relates to 17 gross (16.2 net) operated wells that were in various stages of being drilled or completed at June 30, 2019, three of which were turned online during the first week of July. Including capital expenditures for infrastructure of $15.5 million, which account for approximately two thirds of the expected annual investment and activity, and leasehold acquisition costs of $3.2 million, total capital expenditures for the quarter were $170.7 million.
The table below provides a comparative breakout of the Company's capital expenditures for the periods indicated:
|
Three Months Ended June 30, |
Six Months Ended June 30, |
||||||||||||||
|
(in thousands) |
2019 |
2018 |
2019 |
2018 |
|||||||||||
|
Acquisitions |
|||||||||||||||
|
Proved properties |
$ |
584 |
$ |
- |
$ |
7,407 |
$ |
- |
|||||||
|
Unproved properties |
2,601 |
3,771 |
7,978 |
11,095 |
|||||||||||
|
Drilling and completion costs |
151,960 |
176,178 |
288,690 |
383,793 |
|||||||||||
|
Infrastructure costs |
15,523 |
4,065 |
21,158 |
8,001 |
|||||||||||
|
Exploration costs |
- |
1 |
- |
1 |
|||||||||||
|
Total oil and gas capital expenditures |
$ |
170,668 |
$ |
184,015 |
$ |
325,233 |
$ |
402,890 |
|||||||
The Company continues to drive down its DC&E costs through continued efficiency gains and improvements to its supply chain and strategic sourcing of materials including sand, tubular goods, and cement. These improvements have resulted in a further reduction of the Company's total DC&E costs, which averaged $1,250 per lateral foot in the second quarter of 2019 and approximately $1,270 per lateral foot year-to-date. The Company remains on track to meet its full-year 2019 goal of $1,250 per lateral foot. The Company is tightly focused on further enhancing operational efficiencies and reducing total well costs.
Operational Updates
In the Company's Whiskey River asset, the Company finished drilling its Coriander project. This project is the Company's first six-well co-development project spaced at 1,320 feet, and has recently commenced completions operations. Drilling operations for Coriander averaged approximately 860 feet per day, compared to the 2019 average of approximately 830 feet per day. Completion operations for Coriander started in mid-July and are currently on schedule with two frac crews completing the six wells. The Company expects the project to finish completions and be turned online in late-August, at which point the Company plans to finish drilling and begin completions activity on its Venom project, an eight-well multi-horizon development in the northern portion of Whiskey River.
During the quarter, the Company turned online its first Wolfcamp A well in the central fairway of its Big Tex acreage. Early results from this well, the State Big Tex South 7673-8 11-H, are encouraging, with a two-stream peak IP30 of 104 Boe per 1,000 lateral feet and 90-day cumulative production of approximately 7,500 Boe per 1,000 feet. This compares favorably to the average of the Company's Big Tex wells, which have had average two-stream peak IP30 of approximately 88 Boe per day and 90-day cumulative production of 6,300 Boe per 1,000 feet. The well is currently on artificial lift and continues to show a robust production profile after 130 days of production, with the most recent seven-day average oil production of 1,077 Bbls per day. The Company is drilling and completing two additional Wolfcamp A wells in this fairway in 2019, the first of which is in the early stages of flowing back and the second is currently completing.
The Company also turned online a successful well in its Southeastern Big Tex position during the quarter, that targeted the Woodford formation. This well, the Chimera 3601-142 61H, has an approximate 6,400 foot lateral and was placed entirely in-zone. The early time data of this well has been encouraging, with a two-stream peak IP30 of 294 Boe per 1,000 lateral feet (50% oil). As the production data of this well is preliminary, the Company will continue to monitor and evaluate the performance of this well, and its other 2019 Big Tex wells to inform capital allocation decisions for Big Tex in 2020.
Updated 2019 Capital, Production, and Operating Guidance
For the remainder of the year, the Company plans to continue running five drilling rigs and between one and two completion crews, which are expected to complete between 13-15 wells in each of the remaining quarters of 2019. Development capital guidance is being affirmed at a midpoint of $635 million. For production, the Company is affirming its fourth quarter and full-year guidance ranges and providing guidance for the third quarter. The Company is expecting its oil production to grow sequentially in the third quarter by approximately 3% and then grow by approximately 15% in the fourth quarter as volumes from the Coriander and Venom projects are expected to be turned online in the second half of the third quarter and the beginning of the fourth quarter, respectively. From a cost perspective, the Company is raising the midpoint of its LOE guidance by $0.25 per Boe to account for additional artificial lift costs, and is decreasing its annual G&A guidance by $7.5 million, at the midpoint. The Company has also increased the production and ad valorem tax guidance by 0.5% as a percentage of revenue, due in part to decreased per unit revenues from natural gas and NGLs. As these three changes are netting, they are expected to have a neutral to slightly positive impact to the Company's top-tier adjusted EBITDAX margin. Adjusted EBITDAX margin is a non-GAAP metric. Please reference the reconciliations of this non-GAAP measures to the most directly comparable GAAP measure, Net Income, at the end of this release. The table below provides an updated summary of the Company's capital, production, and operating guidance for the third quarter and full-year 2019.
|
Updated Guidance for the Three Months Ended September 30, 2019 |
|
|
Production |
|
|
Average daily equivalent production (MBoe/d) |
38.6 - 40.2 |
|
Average daily oil production (MBbl/d) |
29.4 - 30.6 |
|
Updated Guidance for the Full-Year 2019 |
|
|
Production |
|
|
Average daily equivalent production (MBoe/d) |
38.6 - 41.0 |
|
Average daily oil production (MBbl/d) |
29.3 - 31.1 |
|
Income Statement |
|
|
Lease operating expense ($/Boe) |
$4.00 - $4.30 |
|
General and administrative (before equity-based compensation) ($MM) (Non-GAAP) |
$39 - $42 |
|
Production and ad valorem taxes (% of revenue) |
6.5% - 7.5% |
|
Capital Expenditures |
|
|
Drilling and completion ($MM) (1) |
$590 - $620 |
|
Infrastructure and other ($MM) |
$27 - $33 |
|
Total development capital ($MM) |
$617 - $653 |
|
Operated Activity |
|
|
Gross horizontal wells brought online |
52 - 56 |
|
Average working interest |
~95% |
|
Average lateral length per well |
8,900' |
|
Non-operated Activity |
|
|
Net horizontal wells brought online |
2 |
|
(1) Includes pad-level infrastructure and equipment |
Financial Update
At the end of the second quarter of 2019, the Company had $150.0 million drawn on its revolving credit facility and $24.8 million of cash on the balance sheet, resulting in total liquidity of $414.8 million. Net debt to LTM adjusted EBITDAX (a non-GAAP measure) was 1.5x as of the end of the second quarter. The Company's current capital program is expected to keep the Company's leverage ratio, as measured by net debt to LTM adjusted EBITDAX, under 2.0x in a $50 per Bbl WTI environment. Please reference the reconciliation of this non-GAAP measure to the most directly comparable GAAP measure at the end of this release.
Since the hedging update on May 9, 2019, the Company has added to its 2020 WTI swaps, which are now at 17,000 Bbls per day of oil for 2020. These additions are included in the commodity hedges schedule at the end of this release.
Related Categories :
Second Quarter (2Q) Update
More Second Quarter (2Q) Update News
-
Berry Reaffirms FY25 Guidance; Uinta Wells Drive 2H Growth
-
SM Energy Hits Record Output; Driven by Uinta
-
Expand Energy Talks, Wells, Frac Crews, Production For 2H-2025 -

-
Comstock Rides Higher Gas Prices, Operational Momentum in Q2 2025
-
A Quarter of Quiet Strength: CNX’s Patient Ascent in Appalachia -
Permian News >>>
-
Why $90 Oil Isn’t Bringing Back the Rigs -

-
These Three Companies Will Increase Drilling & Completion Over The Next 3 Year -

-
Q1 A&D Transactions Jump to $30B , While Deal Flow Was Down 40%

-
Wright to U.S. Oil Industry: The Price Signal Is Telling You to Drill

-
Apa Corp : Doing More With Less

Permian - Delaware Basin News >>>
-
Permian Resources to Grow Production 6% in 2026

-
Battalion Oil Closes ~$60M West Quito Draw Asset Sale

-
Deal Rumor: ConocoPhillips Exploring $2B Permian Asset Sale

-
This Operator Will Chop it's 2026 Rig Count From 34 to 24 -

-
A Quiet Capital Pattern Is Forming in North American Upstream — and Almost No One Is Talking About It -
