
Service & Supply | Rig Count | Quarterly / Earnings Reports | Oilfield Services | Second Quarter (2Q) Update | Financial Results | Capital Markets | Capital Expenditure | Drilling Contractor
Precision Drilling Ups Initial Capex, Focuses on Tier 1 Rigs

Precision Drilling Corporation has announced Q2 2015 results.
Highlights:
- Current expected capital plan for 2015 is $546 million, an increase of $40 million compared to the $506 million capital plan announced in April 2015. The capital increase is due to one additional new-build contract for a ST-1200 rig for deep basin drilling in Canada and additional long lead items. A portion of the 2015 capital plan is utilization based and if activity levels change, Precision has the ability to adjust its plan accordingly.
- The 2015 capital expenditure plan includes $422 million for expansion capital, $78 million for sustaining and infrastructure expenditures, and $46 million to upgrade existing rigs. We expect that the $546 million will be split $540 million in the Contract Drilling segment and $6 million in the Completion and Production Services segment.
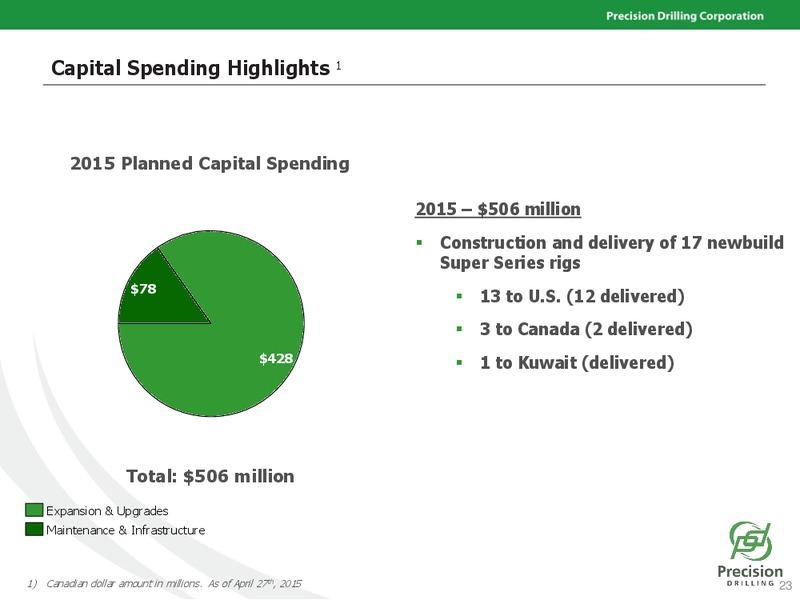
- Precision's expansion capital plan for 2015 includes 18 new-build drilling rigs, 16 of which were delivered in the first half of the year. Of the remaining two rigs, one rig was deployed to Canada early in the third quarter and one is expected to be deployed in Canada in the fourth quarter. Of the 16 rigs delivered, 13 rigs went to the U.S., four to Canada and one to Kuwait, all of which are on long-term contracts.
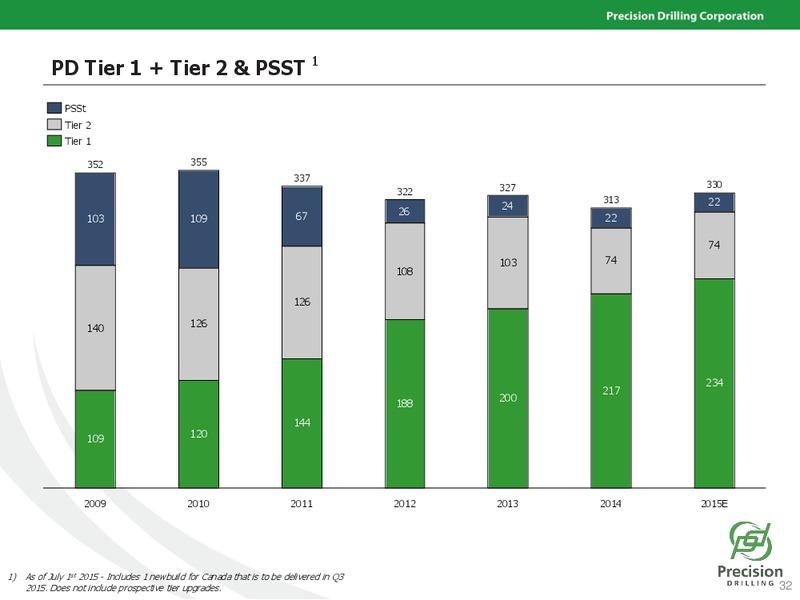
- Of the 18 new-build drilling rigs scheduled for delivery in 2015 (13 rigs in the U.S., four in Canada and one internationally) ten were delivered in the first quarter, six were delivered in the second quarter, one was delivered early in the third quarter and the final rig is scheduled for delivery in the fourth quarter. After delivery of the remaining contracted new-build rig in 2015, Precision's drilling rig fleet will consist of 331 drilling rigs, including 236 Tier 1 rigs, 73 Tier 2 rigs and 22 PSST rigs. For the Tier 1 rigs, 124 will be in Canada, 106 in the U.S. and six internationally.
- Revenue this quarter was $334 million or 30% lower than the second quarter of 2014, mainly due to lower activity from our North American operations.
- Average operating costs per utilization day for drilling rigs increased in the second quarter of 2015 in both Canada and the United States. In Canada costs increased to $12,818, compared to the prior year second quarter of $11,695 and in the U.S. costs increased to US$15,896 in 2015 compared to US$13,502 in 2014. The cost increase in both markets was primarily due to higher labour burden and a lower activity base to spread fixed costs and larger turnkey jobs during the quarter in the United States.
Outlook
Contracts
- Our portfolio of term customer contracts provides a base level of activity and revenue and, as of July 22, 2015, we had term contracts in place for an average of 45 rigs in Canada, 43 in the U.S. and nine internationally for the third quarter of 2015 and an average of 46 rigs contracted in Canada, 47 in the U.S. and 11 internationally for the full year. In Canada, term contracted rigs normally generate 250 utilization days per year because of the seasonal nature of well site access. In most regions in the U.S. and internationally, term contracts normally generate 365 utilization days per year.
Drilling Activity
- In the U.S., our average active rig count in the quarter was 58 rigs, down 36 rigs over the second quarter in 2014 and down 22 rigs from the first quarter of 2015. We currently have 51 rigs active in the U.S.
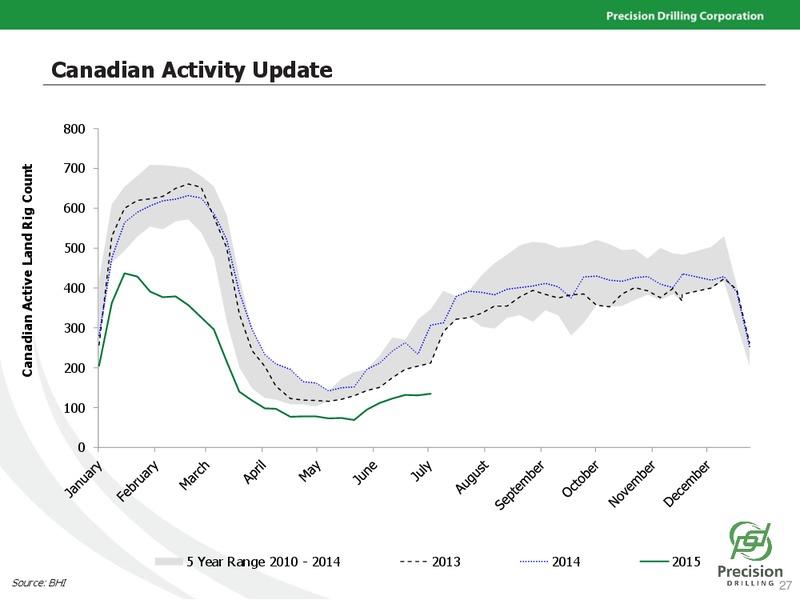
- In Canada, our average active rig count in the quarter was 26 rigs, a decrease of 27 over the second quarter in 2014. We currently have 56 rigs active in Canada and expect typical seasonal volatility through the third quarter, but in general we expect to benefit from the fleet enhancements over the past several years.
- Internationally, our average active rig count in the quarter was 13 rigs, up 2 rigs over the second quarter in 2014 and in line with the first quarter of 2015. During the quarter one new-build rig went to work in Kuwait and was operating at the end of the quarter. We currently have 12 rigs active internationally.
Industry Conditions
- To date in 2015, drilling activity has decreased relative to this time last year for both Canada and the U.S. According to industry sources, as of July 17, 2015, the U.S. active land drilling rig count was down approximately 54% from the same point last year and the Canadian active land drilling rig count was down approximately 50%. The decrease in the North American rig count has resulted in the trend of high-grading toward Tier 1 rigs, which continue to show relative strength given the current market conditions.
- In Canada there has been strength in natural gas and gas liquids drilling activity related to deep basin drilling in northwestern Alberta and northeastern British Columbia while the trend towards oil-directed drilling in the U.S. continues. To date in 2015, approximately 45% of the Canadian industry's active rigs and 77% of the U.S. industry's active rigs were drilling for oil targets, compared to 60% for Canada and 82% for the U.S. at the same time last year.
Kevin Neveu, Precision's President and Chief Executive Officer, stated: "The first half of 2015 has been characterized by substantially reduced demand for our services as our customers grapple with depressed commodity prices and sharply reduced drilling budgets. During this period, the superior performance and value offered by Precision Drilling has been partially overshadowed by the rapid decline in activity, yet we see signs of our market share improving and an emerging shift by customers from managing drilling programs based on contract portfolios to the traditional performance and value based decision factors.
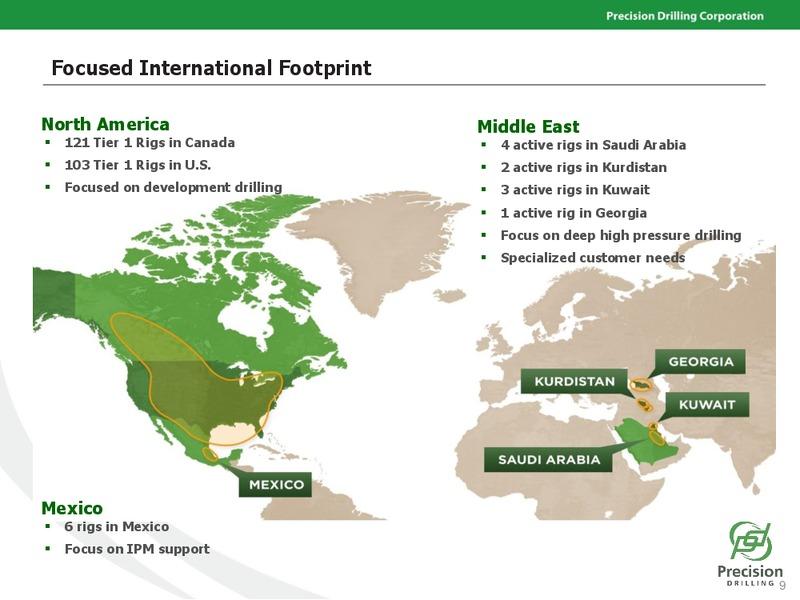
Despite the sharply reduced customer demand and a particularly harsh Canadian spring break-up, Precision's resilient margins and cash flow from operations during the second quarter demonstrate the effectiveness of our variable cost business model and strong contract position enjoyed with our Super Series rigs. Our High Performance drilling fleet of 235 Super Series Tier 1 rigs, comprehensive North American and Middle East footprint, excellent field reputation and strong balance sheet position are foundations for growth as our customers shift their focus back to performance and value.
The Canadian new-build rig announced today, redeployment of several of our U.S. ST-1200 Tier 1 rigs to Canada for deep basin plays and our emerging discussions with customers to reactivate idle Tier 1 rigs later this year are signs that our customers' focus is indeed shifting to High Performance, High Value services we provide.
Internationally, we have successfully deployed our third rig to Kuwait, bringing total deployments for the last twelve months to five rigs, three to Kuwait, one to Saudi Arabia and one to country of Georgia. International activity is generally less volatile than North America, and although there are near-term headwinds, we remain focused on expanding this segment of our business over the long term.
Through this challenging market environment, we will continue to invest in our people, particularly in training and safety for our Precision crews at our Houston and Nisku Tech Centres, while we leverage our scale to lower operating costs and to create value for our customers and shareholders."
Precision's strategic priorities for 2015 are as follows:
- Work with our customers to lower well costs - Deliver High Performance, High Value services to customers to create maximum efficiency and lower risks for development drilling programs. Utilize our unique platform of Tier 1 assets, geographically diverse operations and highly efficient service offering to deliver cost-reducing solutions. Grow our cost-reducing integrated directional drilling service.
- Maximize cost efficiency throughout the organization - Continue to leverage Precision's scale to reduce costs and continue to deliver High Performance. Maximize the benefits of the variable nature of operating and capital expenses. Maintain an efficient corporate cost structure by optimizing systems for assets, people and business management. Maintain our uncompromising focus on worker safety, premium service quality and employee development.
- Reinforce our competitive advantage - Gain market share as Tier 1 assets remain most in demand rigs. High-grade our active rig fleet by delivering new-build rigs and maximizing customer opportunities to utilize High Performance assets. Deliver consistent, reliable, High Performance service. Retain and continue to develop the industry's best people.
- Manage liquidity and focus activities on cash flow generation. Monitor working capital, debt and liquidity. Maintain a scalable cost structure that is responsive to changing competition and market demand. Adjust capital plans according to utilization and customer demand.
- Operating loss this quarter was $32 million, or negative 9% of revenue, compared to operating earnings of $24 million and 5% of revenue in 2014. Operating results were negatively impacted by the decrease in drilling activity and day rates in our North American operating segments partially offset by improved results internationally.
- General and administrative expenses this quarter were $37 million, $5 million lower than the second quarter of 2014. The decrease is primarily due to cost saving initiatives and lower incentive compensation which is tied to the price of our common shares partially offset by the effect of the weakening Canadian dollar on our U.S. dollar denominated expenses and restructuring charges incurred this quarter.
- Net finance charges were $32 million, an increase of $7 million compared with the second quarter of 2014 due to the issuance of US$400 million of 5.25% Senior Notes on June 3, 2014 and the effect of the weakening Canadian dollar on our U.S. dollar denominated interest.
- Average revenue per utilization day for contract drilling rigs increased in the second quarter of 2015 to $22,939 from the prior year second quarter of $22,217 in Canada and increased in the U.S. to US$27,731 from US$24,320. The increase in revenue rates for Canada is primarily due to rig mix and additional Tier 1 rigs operating partially offset by competitive pricing in some rig segments. In Canada, for the second quarter of 2015, 62% of our utilization days were achieved from drilling rigs working under term contracts compared to 53% in the 2014 comparative period. The increase in revenue rates for the U.S. was primarily due to a higher percentage of revenue being generated from Tier 1 rigs compared to the prior year quarter, idle-but-contracted payments and larger turnkey jobs relative to the prior year quarter. In the U.S., for the second quarter of 2015, 78% of our utilization days were generated from rigs working under term contracts compared to 72% in the 2014 comparative period. Turnkey revenue for the second quarter of 2015 was US$17 million compared with US$20 million in the 2014 comparative period. Within the Completion and Production Services segment, average hourly rates for service rigs were $718 in the second quarter of 2015 compared to $940 in the second quarter of 2014. The decrease in the average hourly rate is the result of pricing pressure across all service rig classes and the absence of our U.S. coil tubing assets, which were sold in the fourth quarter of 2014.
- We realized revenue from international contract drilling of $63 million in the second quarter of 2015, a $17 million increase over the prior year period due to expansion in the Middle East with three new-build rigs deployed in 2014, one rig deployed to the country of Georgia in the first quarter of 2015 and one new-build rig deployed in the second quarter to Kuwait. Average revenue per utilization day in our international contract drilling business was US$45,700 an increase of 4% over the comparable prior year quarter.
- Directional drilling services realized revenue of $5 million in the second quarter of 2015 compared with $23 million in the prior year period. The decrease was primarily the result of a decline in activity in both the U.S. and Canada.
- Funds provided by operations in the second quarter of 2015 were $53 million, a decrease of $45 million from the prior year comparative quarter of $98 million. The decrease was primarily the result of lower activity levels.
- Capital expenditures for the purchase of property, plant and equipment were $113 million in the second quarter, a decrease of $62 million over the same period in 2014. Capital spending for the second quarter of 2015 included $94 million for expansion capital, $12 million for upgrade capital and $7 million for the maintenance of existing assets and infrastructure spending.
- Net loss this quarter was $30 million, or $0.10 per diluted share, compared to a net loss of $7 million, or $0.02 per diluted share, in the second quarter of 2014.
- Revenue from our Contract Drilling Services and Completion and Production Services segments decreased over the comparative prior year period by 27% and 46%, respectively.
- Earnings before income taxes, finance charges, foreign exchange, and depreciation and amortization (adjusted EBITDA see "Additional GAAP Measures") this quarter were $88 million or 32% lower than the second quarter of 2014. Our activity for the quarter, as measured by drilling rig utilization days, decreased 52% in Canada and 39% in the U.S. while increasing 17% internationally, compared to the second quarter of 2014. Our adjusted EBITDA as a percentage of revenue was 26% this quarter, compared to 27% in the second quarter of 2014. The decrease in adjusted EBITDA as a percent of revenue was mainly due to decreased activity and lower pricing in our Completion and Production Services segment and costs associated with restructuring, which were $3 million this quarter. EBITDA margin in our Completion and Production Services segment decreased 10 percentage points over the prior year, as activity and pricing remains challenged for this segment.
- Net loss for the first six months of 2015 was $6 million, or $0.02 per diluted share, compared to net earnings of $94 million, or $0.32 per diluted share in 2014, while revenue was $847 million, or 26% less than 2014.
- Revenue for the first half of 2015 was $847 million, a decrease of 26% from the 2014 period.
- Operating earnings were $16 million, a decrease of $140 million or 90% from 2014. Operating earnings were 2% of revenue in 2015 compared to 14% in 2014. Operating earnings were negatively impacted by the decreased drilling activity and rates in our North American operations and depreciation from capital asset additions over the past year and a half.
- General and administrative costs were $82 million, an increase of $1 million over the first half of 2014 primarily as a result of restructuring costs of $5 million and the effect of the weakening Canadian dollar on our U.S. dollar denominated expenses partially offset by cost savings initiatives and lower incentive compensation.
- Net finance charges were $52 million, an increase of $2 million from the first half of 2014 due to the issuance of US$400 million of 5.25% Senior Notes on June 3, 2014 and the effect of the weakening Canadian dollar on our U.S. dollar denominated interest partially offset by $14 million in interest revenue related to an income tax dispute settlement.
- Funds provided by operations (see "Additional GAAP Measures" in this news release) in the first half of 2015 were $208 million, a decrease of $121 million from the prior year comparative period of $329 million.
- Capital expenditures for the purchase of property, plant and equipment were $339 million in the first half of 2015, an increase of $58 million over the same period in 2014. Capital spending for 2015 to date included $292 million for expansion capital, $32 million for upgrade capital and $15 million for the maintenance of existing assets and infrastructure.
Canada News

Western Canada Upstream M&A: Q1 2026 Transaction Report
Western Canadian M&A activity in Q1 2026 was characterized by a 87% decrease in total deal value compared to Q1 2025, totaling $0.8 billion C$. However, transaction volume…

Canadan E&P 2026 Program Calls for 448 Net Wells, Up 24% vs. 2025 Plan
Canadian Natural Resources outlined a 2026 operating capital budget of approximately $6.3 billion (total capital budget $6,425 million, including $125 million for carbon capture) targeting 1,590–1,650 MBOE/d of…

EIA’s “Glut” Calls: The 2025 Surplus Claim — and How 2021–2024 Forecasts Actually Held Up
The “~2.2 MMb/d glut in 2025” framing traces to the EIA’s Short-Term Energy Outlook (STEO), December 2025. EIA doesn’t usually write “glut” in the tables—what they publish is…

Whitecap Details 2026 Duvernay & Montney Program
Whitecap Resources reported strong third quarter 2025 operating and financial results, marking its first full quarter following the strategic combination with Veren that closed on May 12, 2025.…

ARC Resources: Lower 2026 Capex, Higher Volumes
ARC Resources used its third quarter update to reinforce a familiar message to Canadian E&P executives: disciplined capital, structurally better market access, and a growing shareholder return program…
North America News

Baytex 2026 Development Plans
Baytex’s 2026 development plan reflects a post–Eagle Ford sale capital program and a sharpened focus on its core Canadian assets. The Company approved 2026 exploration and development expenditures…

Tourmaline: 2026 Capital Program Locked In at $2.9B
Tourmaline’s 2026 exploration and production (EP) program is set at $2.9 billion and targets average production of 690,000–710,000 boepd, with the company maintaining the multi-year EP Plan released…

Cenovus Outlines 2026 Development Plan Following MEG Integration
Cenovus’ 2026 plan targets capital investment of $5.0 billion to $5.3 billion (including ~$350 million of capitalized turnaround costs) and upstream production of 945,000 BOE/d to 985,000 BOE/d,…

Gran Tierra Energy To Step Down Activity in 2026
Gran Tierra Energy’s 2026 development plan reflects a step-down in spending and activity as the company transitions from fulfilling Ecuador exploration commitments in 2025 toward a free-cash-flow-focused program.…

Advantage Plans $300–$330MM 2026 Capital Program
Advantage’s 2026 development plan centers on Glacier-focused drilling and key midstream work. The company plans total capital spending of $300 million to $330 million and expects production to…