
Drilling & Completions | Quarterly / Earnings Reports | Third Quarter (3Q) Update | Financial Results | Hedging | Capital Markets
CNX Resources Third Quarter 2020 Results

CNX Resources reported its Q3 2020 results.
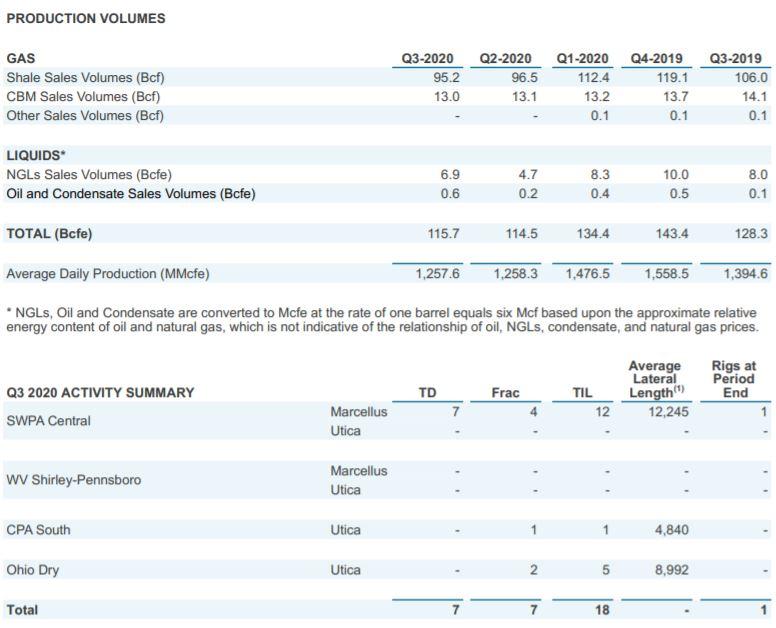
Production & Drilling Summary
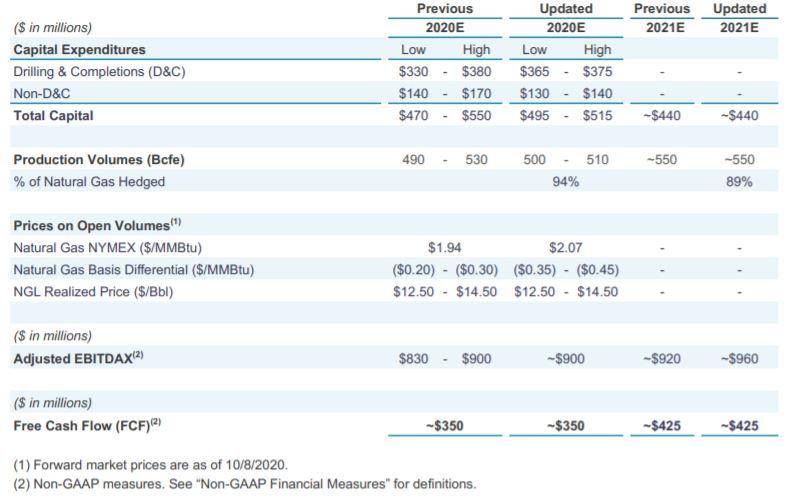
Guidance
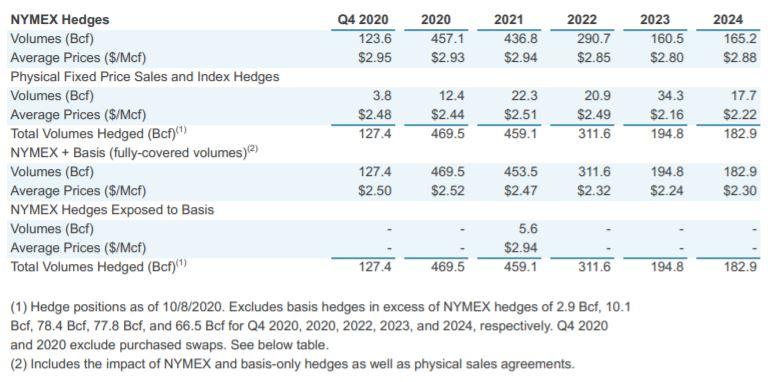
Hedges
Financials
Cash flows from operating activities changed in the period-to-period comparison primarily due to the following items:
- Net income decreased $897 million in the period-to-period comparison.
- Adjustments to reconcile net income to cash provided by operating activities primarily consisted of a $473 million impairment of goodwill, a $62 million impairment of exploration and production properties, a $265 million change in deferred income taxes, a $729 million net change in derivative instruments, a $25 million decrease in stock-based compensation expense, a $21 million increase in gain on asset sales and abandonments, and a $18 million increase in the gain on debt extinguishment.
Cash flows from investing activities changed in the period-to-period comparison primarily due to the following items:
- Capital expenditures decreased $569 million in the period-to-period comparison primarily due to decreased expenditures in the Shale segment resulting from decreased drilling and completions activity. Gathering capital expenditures decreased due primarily to the substantial build out that was completed during 2019.
- Proceeds from asset sales increased $17 million mainly due to increased surface sales and oil and gas assignment sales in the nine months ended September 30, 2020.
Q3 Shale Segment Results
The Shale segment had natural gas, NGL and oil revenue of $156 million for the three months ended September 30, 2020 compared to $229 million for the three months ended September 30, 2019. The $73 million decrease was primarily due to a 27.3% decrease in the average sale price for natural gas and a 4.4% decrease in the average sale price of NGLs, along with a 10.1% decrease in total Shale sales volumes. The decrease in total Shale sales volumes was primarily due to the temporary shut-in of new turn-in-line wells in 2020 due to low natural gas prices.
The decrease in the total average Shale sales price was primarily due to a $0.54 per Mcf decrease in the average sales price for natural gas and a $0.10 per Mcfe decrease in the average NGL sales price, offset in part by a $0.36 per Mcf increase in the realized gain on commodity derivative instruments resulting from the Company's hedging program. The notional amounts associated with these financial hedges represented approximately 89.3 Bcf of the Company's produced Shale gas sales volumes for the three months ended September 30, 2020 at an average gain of $0.89 per Mcf hedged. For the three months ended September 30, 2019, these financial hedges represented approximately 90.3 Bcf at an average gain of $0.56 per Mcf hedged.
Total operating costs and expenses for the Shale segment were $166 million for the three months ended September 30, 2020 compared to $186 million for the three months ended September 30, 2019. The decrease in total dollars and decrease in unit costs for the Shale segment were due to the following items:
- Shale lease operating expenses were $7 million for the three months ended September 30, 2020 compared to $10 million for the three months ended September 30, 2019. The decrease in total dollars and in unit costs was primarily due to a decrease in water disposal costs in the current period due to an increase in the reuse of produced water in well completions activity.
- Shale transportation, gathering and compression costs were $60 million for the three months ended September 30, 2020 compared to $70 million for the three months ended September 30, 2019. The decreases in total dollars and unit costs were primarily related to lower processing costs and a decrease in firm transportation expense due to lower gas sales volumes.
- Depreciation, depletion and amortization costs attributable to the Shale segment were $94 million for the three months ended September 30, 2020 compared to $101 million for the three months ended September 30, 2019. These amounts included depletion on a unit of production basis of $0.81 per Mcfe and $0.82 per Mcfe, respectively. The decrease in units of production depreciation, depletion and amortization rate in the current period is the result of positive reserve revisions within our core SWPA development area and lower cost reserves added in our core SWPA development area from the 2019 development program partially offset by an increase in the units of production depreciation, depletion and amortization rate due to negative reserves revisions within our Ohio operations. The remaining depreciation, depletion and amortization costs were either recorded on a straight-line basis or related to asset retirement obligations.
Total Shale other revenue and operating income relates to natural gas gathering services provided to third-parties. The Shale segment had other revenue and operating income of $17 million for the three months ended September 30, 2020 compared to $19 million for the three months ended September 30, 2019. The decrease in the period-to-period comparison was primarily due to a reduction in third-party volumes transported related to temporary production curtailments.
COVID-19 Information
CNX continues to monitor the current and potential impacts of the coronavirus COVID-19 pandemic on all aspects of our business and geographies, including how it has impacted, and may in the future, impact our operations, financial results, liquidity, contractors, customers, employees and vendors. The Company also continues to monitor a number of factors that may cause actual results of operations to differ from our historical results or current expectations. These factors include: the impact of the COVID-19 pandemic and the related global economic downturn, the historically low natural gas prices and the historically low natural gas liquids prices that began with the crude oil price war between the Organization of Petroleum Exporting Countries ("OPEC")/Saudi Arabia and Russia in the first quarter of 2020. The natural gas liquids prices have rebounded in the third quarter. These and other factors could affect the Company’s operations, earnings and cash flows for any period and could cause such results to not be comparable to those of the same period in previous years. The results presented in this Form 10-Q are not necessarily indicative of future operating results.
While CNX did not incur significant disruptions to operations during the three or nine months ended September 30, 2020 as a direct result of the COVID-19 pandemic, CNX is unable to predict the impact that the COVID-19 pandemic will have on us, including our financial position, operating results, liquidity and ability to obtain financing in future reporting periods, due to numerous uncertainties. These uncertainties include the volatility and severity of the virus, the duration of the outbreak, the availability of a vaccine, governmental or other actions taken to combat the virus (which could include limitations on our operations or the operations of our customers and vendors), and the effect that the COVID-19 pandemic will have on the demand for natural gas and natural gas liquids. The continued health of our employees, contractors and vendors, and our ability to meet staffing needs in our operations and certain critical functions is vital to our operations and cannot currently be predicted. Further, the continuing impacts of a potential worsening of global economic conditions and the continued disruptions to, and volatility in, the credit and financial markets as well as other unanticipated consequences remain unknown. In addition, CNX cannot predict the impact that COVID-19 will have on our customers, vendors and contractors; however, any material effect on these parties could adversely impact CNX. For instance, in the short term, CNX is starting to see a reduction in overall service and materials costs, due to oversupply of those services and costs, since industrial production has waned. However, if services providers to our industry are forced into bankruptcy or otherwise consolidate due to weakening economic conditions, demand could outpace supply in the long-term and cause these costs to increase. The situation surrounding COVID-19 remains fluid and unpredictable, and CNX is actively managing our response in collaboration with our contractors, customers, employees and vendors and assessing potential impacts to our financial position and operating results, as well as any adverse developments that could impact our business.
CNX has also taken, and is continuing to take, proactive steps to manage any disruption in our business caused by COVID-19. For instance, even though our operations were not required to close, CNX was an early adopter in employing a work-from-home system, even before any government mandate on non-essential businesses was enacted. CNX increased its technology platform, infrastructure and security to allow for a work-from-home environment ahead of the actual need, and therefore, once the hypothetical became a reality, we believe CNX was ahead of many companies in this respect. CNX has also deployed additional safety protocols at our field sites in order to help keep our employees and contractors safe and to keep our operations running without material disruption. As the COVID-19 pandemic continues to unfold, CNX will continue to assess and update its protocols.
Recent Business Developments
On September 28, 2020, we completed the acquisition of all of the outstanding common units of CNX Midstream Partners LP ("CNXM") and CNXM became our indirect wholly-owned subsidiary. In connection with the closing of the Merger, we issued 37.1 million shares of our common stock to acquire the 42.1 million common units of CNXM held by third-party CNXM investors at a fixed exchange ratio of 0.88 shares of CNX common stock for each CNXM common unit, for total implied consideration of $384.6 million.
Nine Month Results
The Shale segment had natural gas, NGL and oil/condensate revenue of $529 million for the nine months ended September 30, 2020 compared to $918 million for the nine months ended September 30, 2019. The $389 million decrease was due primarily to a 37.8% decrease in the average sales price for natural gas, an 8.1% decrease in total Shale sales volumes, and a 36.3% decrease in the average sales price of NGLs.
The decrease in total Shale volumes was due to the temporary shut-in of a portion of CNX's liquids-rich Shirley-Pennsboro production in May and June of 2020 in response to low NGL prices. Additionally, four new pads of dry gas turn-in-lines from April and May were temporarily shut-in during May through September due to low natural gas prices. Normal production declines also contributed to the decrease in total Shale volumes.
The decrease in total average Shale sales price was primarily due to a $0.96 per Mcf decrease in average gas sales price and a $1.16 per Mcfe decrease in the average NGL sales price. These decreases were offset in part by a $0.81 per Mcf increase in the realized gain on commodity derivative instruments. The notional amounts associated with these financial hedges represented approximately 296.6 Bcf of the Company's produced Shale gas sales volumes for the nine months ended September 30, 2020 at an average gain of $0.90 per Mcf hedged. For the nine months ended September 30, 2019, these financial hedges represented approximately 246.5 Bcf at an average gain of $0.10 per Mcf hedged.
Total operating costs and expenses for the Shale segment were $511 million for the nine months ended September 30, 2020 compared to $587 million for the nine months ended September 30, 2019. The decrease in total dollars and decrease in unit costs for the Shale segment were due to the following items:
- Shale lease operating expense was $19 million for the nine months ended September 30, 2020 compared to $40 million for the nine months ended September 30, 2019. The decrease in total dollars was primarily due to a decrease in water disposal costs in the current period resulting from an increase in the reuse of produced water in well completions activity. The decrease in unit costs was driven by the decrease in total dollars.
- Shale transportation, gathering and compression costs were $183 million for the nine months ended September 30, 2020 compared to $215 million for the nine months ended September 30, 2019. The decreases in total dollars and unit costs were primarily related to lower processing costs due to a drier production mix. Lower firm transportation costs from lower gas sales volumes contributed to the decrease in total dollars.
- Depreciation, depletion and amortization costs attributable to the Shale segment were $295 million for the nine months ended September 30, 2020 compared to $317 million for the nine months ended September 30, 2019. These amounts included depletion on a unit of production basis of $0.81 per Mcfe and $0.82 per Mcfe, respectively. The decrease in the units of production depreciation, depletion and amortization rate in the current period is the result of positive reserve revisions within our core SWPA development area and lower cost reserves added in our core SWPA development area from the 2019 development program partially offset by an increase in the units of production depreciation, depletion and amortization rate due to negative reserves revisions within our Ohio operations. The remaining depreciation, depletion and amortization costs were either recorded on a straight-line basis or related to asset retirement obligations.
Total Shale other revenue and operating income relates to natural gas gathering services provided to third-parties. The Shale segment had other revenue and operating income of $47 million for the nine months ended September 30, 2020 compared to $56 million for the nine months ended September 30, 2019. The decrease in the period-to-period comparison was primarily due to a reduction in third-party volumes transported related to temporary production curtailments.
Credit Facilities
In April 2019, CNX amended its senior secured revolving credit facility ("Credit Facility") and extended its maturity to April 2024. The lenders' commitments remained unchanged at $2,100,000, with an accordion feature that allows the Company to increase commitments to $3,000,000. In addition, the cumulative credit basket for dividends and distributions was replaced with a basket for dividends and distributions subject to a pro forma net leverage ratio of at least 3.00 to 1.00 and availability under the Credit Facility of at least 15% of the aggregate commitments. In April 2020, as part of the semi-annual borrowing base redetermination, both the lenders' commitments and borrowing base decreased to $1,900,000, and the $650,000 letters of credit aggregate sub-limit remained unchanged. The amount of balance sheet cash that CNX may have on hand is also limited to $150,000 when loans under the credit agreement are outstanding, subject to certain exceptions. If the aggregate principal amount of the existing 5.875% Senior Notes due in April 2022 and certain other publicly traded debt securities outstanding 91 days prior to the earliest maturity of such debt (the "Springing Maturity Date") is greater than $500,000, then the Credit Facility will mature on the Springing Maturity Date. In October 2020, as part of the semi-annual borrowing base redetermination, the lenders' reaffirmed CNX's $1,900,000 borrowing base.
Under the terms of the agreement, borrowings under the revolving credit facility will bear interest at CNX's option at either:
- the base rate, which is the highest of (i) the federal funds open rate plus 0.50%, (ii) PNC Bank, N.A.’s prime rate, or (iii) the one-month LIBOR rate plus 1.0%, in each case, plus a margin ranging from 0.75% to 1.75%; or
- the LIBOR rate, which is the LIBOR rate plus a margin ranging from 1.75% to 2.75%.
The CNX Credit Facility is secured by substantially all of the assets of CNX and certain of its subsidiaries (excluding the certain excluded subsidiaries, which includes Cardinal States Gathering LLC, CNX Midstream GP LLC and CNXM, and their respective subsidiaries). Fees and interest rate spreads are based on the percentage of facility utilization, measured quarterly.
CNXMCNX Midstream Partners LP (CNXM) CNXM’s revolving credit facility was not impacted by the Merger (See Note 13- Acquisitions and Dispositions).
In April 2019, CNXM amended its senior secured revolving credit facility and extended its maturity to April 2024. The lenders’ commitments remained unchanged at $600,000, with an accordion feature that allows CNXM to increase the available borrowings by up to an additional $250,000 under certain terms and conditions. Among other things, the revolving credit facility now includes (i) the addition of a restricted payment basket permitting cash repurchases of Incentive Distribution Rights (IDRs) subject to a pro forma secured leverage ratio of 3.00 to 1.00, a pro forma total leverage ratio of 4.00 to 1.00 and pro forma availability of 20% of commitments and (ii) a restricted payment basket for the repurchase of LP units not to exceed Available Cash (as defined in the partnership agreement) in any quarter, of up to $150,000 per year and up to $200,000 during the life of the facility.
Under the terms of the amended agreement, borrowings under the revolving credit facility will bear interest at CNXM's option at either:
- the base rate, which is the highest of (i) the federal funds open rate plus 0.50%, (ii) PNC Bank, N.A.’s prime rate, or (iii) the one-month LIBOR rate plus 1.0%, in each case, plus a margin ranging from 0.50% to 1.50%; or
- the LIBOR rate, plus a margin ranging from 1.50% to 2.50%.
Fees and interest rate spreads under the CNXM credit facility are based on the total leverage ratio, measured quarterly. The CNXM credit facility includes the ability to issue letters of credit up to $100,000 in the aggregate.
At September 30, 2020, the CNXM credit facility had $343,000 of borrowings outstanding and $30 of letters of credit outstanding, leaving $256,970 of unused capacity. At December 31, 2019, the CNXM credit facility had $311,750 of borrowings outstanding, leaving $288,250 of unused capacity.
During the three and nine months ended September 30, 2020, CNX completed a private offering of $200,000 of 7.25% senior notes due in March 2027 plus $7,000 of unamortized bond premium. The notes are guaranteed by most of CNX's subsidiaries but do not include CNXM's general partner or CNXM.
More Third Quarter (3Q) Update News

Keystone Runs Steady as Blackrod Gas Link Nears Startup
Nov. 13, 2025 South Bow’s 3Q25 update was operationally focused: the Keystone Pipeline System maintained steady utilization while the company advanced integrity work tied to the MP-171 incident,…

Evolution Petroleum Corporation Fiscal Third Quarter 2023 Results
Evolution Petroleum Corporation announced fiscal third quarter 2023 results. Highlights Reported sequential growth in revenue of 9% to a record $36.9 million and in net income of 34%…

Civitas Resources Third Quarter 2022 Results
Civitas Resources, Inc. announced its third quarter 2022 financial and operating results. Third Quarter 2022 Highlights: Average daily sales volumes of 176.3 thousand barrels of oil equivalent per…

Murphy Oil Third Quarter 2022 Results
Murphy Oil Corp. announced its financial and operating results for the third quarter 2022. Murphy reported net income attributable to Murphy of $528 million, or $3.36 per diluted…

ConocoPhillips Third Quarter 2022 Results
ConocoPhillips reported its third quarter 2022 results. The company reported third-quarter 2022 earnings of $4.5 billion, or $3.55 per share, compared with third-quarter 2021 earnings of $2.4 billion,…
Northeast News

Why $90 Oil Isn’t Bringing Back the Rigs
Higher oil prices are not translating cleanly into a drilling response across U.S. shale, and company disclosures are starting to show why. The issue is not simply capital…

Q1 A&D Transactions Jump to $30B , While Deal Flow Was Down 40%
The first quarter of 2026 has officially defined the "Barbell Era" of American oil and gas. While the total number of deals plummeted by 46% YoY (dropping to…

Ascent Resources 2026: A Quiet Growth Story for Oilfield Services
Ascent Resources may not be making headlines with rig additions or dramatic well count increases, but a closer read of their March 2026 investor presentation — compared against…

Infinity Closes $1.2B Utica Upstream & Midstream Deal
Infinity Natural Resources has completed its $1.2 billion acquisition of upstream and midstream assets in the Ohio Utica Shale from Antero Resources and Antero Midstream, according to company disclosures…

Antero Resources Completes $2.8B Marcellus Expansion
Antero Resources Completes $2.8B Marcellus Expansion Antero Resources has completed the previously announced acquisition of upstream assets from HG Energy II, LLC, significantly expanding its core position in…
Northeast - Appalachia News

A Quiet Capital Pattern Is Forming in North American Upstream — and Almost No One Is Talking About It
A handful of recent transactions and capital raises point to a subtle pattern in North American upstream—one that is easy to miss because each event, on its own,…

Ascent is quietly setting the Utica productivity curve
For most of the last few years, the Utica story has been about discipline: fewer rigs, fewer headlines, and steady execution from a handful of operators who know…

Kimmeridge Offers $6 Billion for Ascent Resources: A Bid Lands in the Middle of a High-Stakes Sponsor Dispute
What happened Kimmeridge Energy Management has submitted a $6 billion offer to buy Ascent Resources, the privately held U.S. natural gas producer that is controlled by private equity…

Dallas Fed Energy Survey: What Oil and Gas Executives Are Really Saying
The latest Dallas Fed Energy Survey shows a U.S. oil and gas industry that is not collapsing—but is clearly constrained. Executives are operating in a defensive posture, focused…

Infinity and NOG Buy Antero's Ohio Utica Assets for $1.2B: A Vertical-Integration Utica Power Move
Infinity Natural Resources (NYSE: INR) is making a statement in Appalachia. On December 5, 2025, Infinity announced it has signed agreements to acquire a package of upstream and…