
Well Cost | Well Lateral Length | Drilling / Well Results | Top Story | Quarterly / Earnings Reports | Third Quarter (3Q) Update | Key Wells | Financial Results | Capital Markets | Capital Expenditure | Private Equity Activity
Chesapeake's Completion Design Boosts Results; Capex Cut

Chesapeake Energy Corporation reported financial and operational results for the 2015 third quarter.
Key Points:
- Lowered 2015 capital guidance to $3.4 to $3.9 billion and are prepared to execute on a significantly lower capital program in 2016
- Chesapeake's 2015 third quarter drilling and completion capital expenditures decreased 41% sequentially to approximately $467 million
Highlights include:
- Production averaged approximately 667,000 boe per day, an increase of 3% year over year, adjusted for asset sales
- Adjusted net loss of $0.05 per fully diluted share and adjusted ebitda of $560 million
- 2015 total production guidance increased to 670 – 680 mboe per day
- 2015 production expense and general and administrative expense guidance lowered significantly
- 2015 capital guidance reduced to $3.4 – $3.9 billion
Doug Lawler, Chesapeake's Chief Executive Officer, commented, "The many actions that we have taken this quarter, including executing new gas gathering agreements, amending our revolving credit facility, reducing complexity and commitments and lowering our business costs, have significantly increased Chesapeake's ability to create additional value. Our focus on optimizing base production and continuing to generate efficiencies in the field drove a 3% increase in production compared to last year, adjusted for asset sales. In addition, the elimination of $200 million of annualized, controllable production and general and administrative expenses represents another step in our commitment to financial discipline.
"We lowered our 2015 capital guidance to $3.4 to $3.9 billion and are prepared to execute on a significantly lower capital program in 2016. While the current price environment presents many challenges for our industry, we will continue focusing on our capital and operating cost efficiency, enhancing our cash flow and financial flexibility and optimizing our base production. The power of our people, the strength of our portfolio and our operational leadership will continue to create value for Chesapeake for the long term."
Production
Capital Spending and Cost Overview
Chesapeake's 2015 third quarter drilling and completion capital expenditures decreased 41% sequentially to approximately $467 million, and capital expenditures for leasehold, geological and geophysical costs and other property, plant and equipment remained flat at approximately $57 million, for a total of approximately $524 million. Total 2015 third quarter capital expenditures of $623 million, including capitalized interest of $99 million, decreased 35% and 59% compared to 2015 second quarter and 2014 third quarter results, respectively, and are detailed in the table below. For 2015, the company has reduced its estimated total capital expenditures to $3.4 – $3.9 billion, compared to $3.5 – $4.0 billion as previously provided.

Chesapeake's focus on cost discipline continued to generate reductions in production and G&A expenses. Production expenses during the 2015 third quarter were $4.09 per boe, while G&A expenses (including stock-based compensation) during the 2015 third quarter were $0.79 per boe. Combined production expenses and G&A expenses (including stock-based compensation) during the 2015 third quarter decreased 10% sequentially and 9% year over year.
Operational Results – Southern Division
Eagle Ford Shale (South Texas)
Eagle Ford net production averaged approximately 108 thousand barrels of oil equivalent (mboe) per day (234 gross operated mboe per day) during the 2015 third quarter, an increase of 3% sequentially. Average completed well costs to date in 2015 are $5.3 million with an average completed lateral length of 6,000 feet and 21 frac stages, compared to the full-year 2014 average completed well cost of $5.9 million with an average completed lateral length of 5,850 feet and 18 frac stages. Chesapeake continues to realize significant efficiencies with longer laterals and larger completions in the area. Recent third quarter well results include the Rogers E-1H and Faith San Pedro F-4H wells, which had completed lateral lengths of 12,488 and 13,151 feet, respectively, and reached peak 24-hour production rates of 1,479 and 1,067 bbls of oil per day, respectively. These two long-lateral wells have an average field estimated completed well cost of $7.8 million each. The JEA Unit XIV LAS S 4H East Four Corners well was also completed in the third quarter using an enhanced design on a 4,611-foot completed lateral and reached a peak 24-hour rate of 1,311 bbls of oil per day. The field estimated completed well cost of this well is $4.8 million. The company placed 30 wells on production during the 2015 third quarter, compared to 89 wells in the 2014 third quarter. Chesapeake's operated rig count in the Eagle Ford averaged three rigs in the 2015 third quarter, and the company anticipates maintaining three operated rigs through the end of the year.
Haynesville Shale and Bossier Shales (Northwest Louisiana)
Haynesville net production averaged approximately 636 million cubic feet of natural gas (mmcf) per day (1.03 gross operated bcf per day) during the 2015 third quarter, a decrease of 5% sequentially. Average completed well costs to date in 2015 are $7.7 million with an average completed lateral length of 5,000 feet and 14 frac stages, compared to the full-year 2014 average completed well cost of $8.4 million with an average completed lateral length of 4,900 feet and 14 frac stages. The company placed seven wells on production during the 2015 third quarter, compared to 14 wells in the 2014 third quarter. Operated rig count in the Haynesville averaged six rigs in the 2015 third quarter, and the company anticipates maintaining six operated rigs through the end of the year.
Mississippian Lime (Northern Oklahoma)
Mississippian Lime net production averaged approximately 31 mboe per day (74 gross operated mboe per day) during the 2015 third quarter, a decrease of 1% sequentially. Average completed well costs to date in 2015 are $2.8 million with an average completed lateral length of 4,500 feet and nine frac stages, compared to the full-year 2014 average completed well cost of $3.0 million with an average completed lateral length of 4,450 feet and nine frac stages. During the 2015 third quarter, the company drilled a record lateral length of 9,395 feet in the JJJ 23-25-11 1H well, which is currently being completed. Chesapeake also drilled its first multi-lateral well in the Mississippian Lime. The Wilber 26-27-11 1H, which had dual laterals of 4,653 feet and 4,556 feet, is currently being completed. The company placed 13 wells on production during the 2015 third quarter, compared to 44 wells in the 2014 third quarter. Operated rig count in the Mississippian Lime averaged three rigs during the 2015 third quarter, and the company has released all operated rigs in the area through the end of the year.
Oklahoma STACK (Northwest and Central Oklahoma)
The company has identified multiple stacked liquids-rich opportunities on its extensive Oklahoma STACK leasehold position, substantially all of which is held by production. During the 2015 third quarter, the company drilled its first two wells targeting the Meramec formation, and is currently drilling a third well, with encouraging results. The Rouce 4-17-10 1H, which has a completed lateral of 9,350 feet, was recently placed on production and has reached over 870 bbls of oil per day after three days. The Wittrock 16-16-9 1H has been drilled with a lateral length of 9,220 feet and is currently being completed. The Stangl 36-16-9 1H is currently drilling with a planned lateral length of 9,426 feet. The company intends to keep one operated rig in the STACK area through the end of the year.
Operational Results – Northern Division
Utica Shale (Eastern Ohio)
Utica net production averaged approximately 106 mboe per day (183 gross operated mboe per day) during the 2015 third quarter, a decrease of 15% sequentially, as the company voluntarily curtailed approximately 20 net mboe per day during the quarter as a result of weak product pricing. During the 2015 fourth quarter, a new regional pipeline is expected to be placed in-service, allowing the company to move an additional 350 mmcf per day out of the basin and greater access to Gulf Coast pricing. Average completed well costs to date in 2015 are $7.7 million with an average completed lateral length of 7,900 feet and 40 frac stages, compared to the full-year 2014 average completed well cost of $7.2 million with an average completed lateral length of 6,200 feet and 29 frac stages. During the 2015 third quarter, the company drilled a new record lateral length in the Utica of 12,976 feet. Additionally, the average cycle time for Utica wells drilled in the third quarter was 9.9 days, with a record cycle time of 6.8 days. Operated rig count in the Utica averaged two rigs in the 2015 third quarter, and the company anticipates maintaining two operated rigs through the end of the year.
Marcellus Shale (Northern Pennsylvania)
Marcellus net production averaged approximately 809 mmcf per day (1.77 gross operated bcf per day) during the 2015 third quarter, a decrease of 1% sequentially. Chesapeake has been voluntarily curtailing production from the area since the 2015 first quarter, primarily due to weak in-basin gas prices. The company anticipates maintaining Marcellus curtailments for the remainder of the year and actively managing its production through the winter months. Average completed well costs to date in 2015 are $6.4 million with an average completed lateral length of 6,800 feet and 29 frac stages, compared to the full-year 2014 average completed well cost of $7.5 million with an average completed lateral length of 6,000 feet and 27 frac stages. Recent third quarter well results include two tests of the Upper Marcellus formation located in Bradford County, Pennsylvania, which had completed lateral lengths of 5,600 feet and 4,800 feet, respectively, and reached peak 24-hour production rates of approximately 19,000 mcf per day and 17,000 mcf per day, respectively. The company believes that these successful completions in the Upper Marcellus could provide more than 1,000 potential new drilling locations. Operated rig count in the Marcellus averaged one rig in the 2015 third quarter, and the company anticipates maintaining one operated rig through the end of the year.
Powder River Basin (PRB) (Wyoming)
PRB net production averaged approximately 21 mboe per day (31 gross operated mboe per day) during the 2015 third quarter, an increase of 5% sequentially. Average completed well costs to date in 2015 are $10.6 million with an average completed lateral length of 5,900 feet and 22 frac stages, compared to the full-year 2014 average completed well cost of $10.6 million with an average completed lateral length of 5,400 feet and 20 frac stages. Recent third quarter well results include the Barton 32-34-67 USA A 1H, which was placed on production in October with a completed lateral length of 9,500 feet and reached a peak 24-hour production rate of 1,500 boe per day (85% black oil) from the Niobrara formation. Operated rig count in the PRB averaged one rig in the 2015 third quarter, and the company has released all operated rigs in the area through the end of the year.
3Q2015 Daily Production of 667,000 Boe Increased 3% YOY
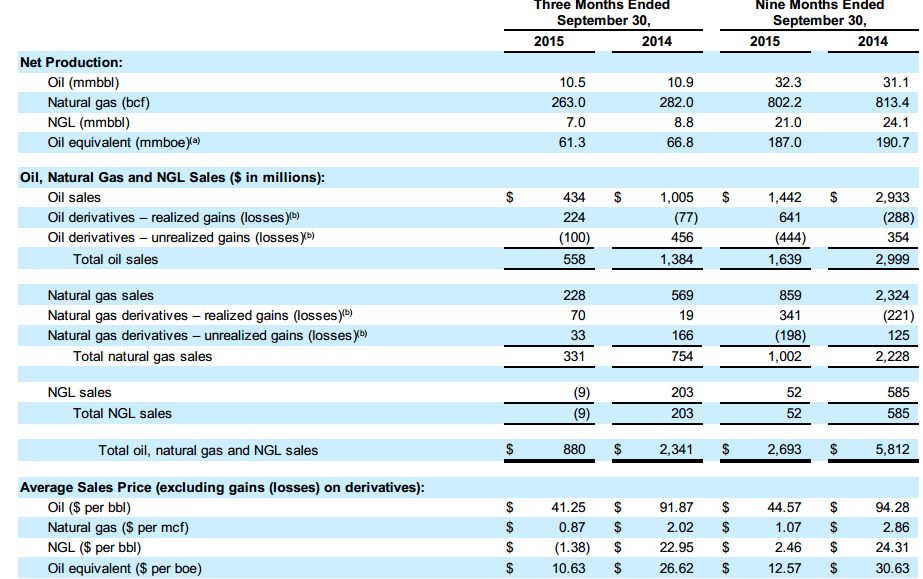
Chesapeake's daily production for the 2015 third quarter averaged approximately 667,000 barrels of oil equivalent (boe), a year-over-year increase of 3% adjusted for asset sales. Average daily production in the 2015 third quarter consisted of approximately 114,100 barrels (bbls) of oil, 2.9 billion cubic feet (bcf) of natural gas and 76,200 bbls of NGL, which represent year-over-year increases of 4%, 2% and 7%, respectively, adjusted for asset sales. During the 2015 third quarter, the company had average curtailed production of approximately 51,000 boe per day. The company has increased its total 2015 production guidance to 670,000 – 680,000 boe per day, representing a 6% – 8% increase over 2014 results, adjusted for asset sales.
2015 Third Quarter Financial Results
For the 2015 third quarter, Chesapeake reported a net loss available to common stockholders of $4.695 billion, or $7.08 per fully diluted share, which compares to net income available to common stockholders of $169 million, or $0.26 per fully diluted share, in the 2014 third quarter. Items typically excluded by securities analysts in their earnings estimates reduced 2015 third quarter net income by approximately $4.612 billion on an after-tax basis and are presented on Page 12 of this release. The primary source of this reduction was a noncash impairment of the carrying value of Chesapeake's oil and natural gas properties largely resulting from significant decreases in the trailing 12-month average first-day-of-the-month oil and natural gas prices as of September 30, 2015, compared to June 30, 2015. Adjusting for this and other items, the 2015 third quarter net loss available to common stockholders was $83 million, or $0.05 per fully diluted share, which compares to adjusted net income available to common stockholders of $251 million, or $0.38 per fully diluted share, in the 2014 third quarter.
Adjusted ebitda was $560 million in the 2015 third quarter, compared to $1.236 billion in the 2014 third quarter. Operating cash flow was $476 million in the 2015 third quarter, compared to $1.293 billion in the 2014 third quarter. The year-over-year decreases in adjusted ebitda and operating cash flow were primarily the result of lower realized oil, natural gas and natural gas liquid (NGL) prices, partially offset by higher realized hedging gains and lower production expenses, general and administrative (G&A) expenses and production taxes.
More Third Quarter (3Q) Update News

Keystone Runs Steady as Blackrod Gas Link Nears Startup
Nov. 13, 2025 South Bow’s 3Q25 update was operationally focused: the Keystone Pipeline System maintained steady utilization while the company advanced integrity work tied to the MP-171 incident,…

Evolution Petroleum Corporation Fiscal Third Quarter 2023 Results
Evolution Petroleum Corporation announced fiscal third quarter 2023 results. Highlights Reported sequential growth in revenue of 9% to a record $36.9 million and in net income of 34%…

Civitas Resources Third Quarter 2022 Results
Civitas Resources, Inc. announced its third quarter 2022 financial and operating results. Third Quarter 2022 Highlights: Average daily sales volumes of 176.3 thousand barrels of oil equivalent per…

Murphy Oil Third Quarter 2022 Results
Murphy Oil Corp. announced its financial and operating results for the third quarter 2022. Murphy reported net income attributable to Murphy of $528 million, or $3.36 per diluted…

ConocoPhillips Third Quarter 2022 Results
ConocoPhillips reported its third quarter 2022 results. The company reported third-quarter 2022 earnings of $4.5 billion, or $3.55 per share, compared with third-quarter 2021 earnings of $2.4 billion,…
Gulf Coast - South Texas News

Western Canada Upstream M&A: Q1 2026 Transaction Report
Western Canadian M&A activity in Q1 2026 was characterized by a 87% decrease in total deal value compared to Q1 2025, totaling $0.8 billion C$. However, transaction volume…

An Eagle Ford Team That Cashed Out Is Back for Another Cycle
Houston — January 15, 2026 — Lime Rock Partners, a Houston-based private investment firm specializing in upstream oil and gas, has completed an equity commitment to Athena Energy…

Silver Hill Expands South Texas Footprint with Acquisition of 1776 Energy Assets
Silver Hill Energy Partners has acquired 100 percent of 1776 Energy’s South Texas oil and gas assets, significantly expanding its operated footprint across the Eagle Ford and Austin…

Whitecap Details 2026 Duvernay & Montney Program
Whitecap Resources reported strong third quarter 2025 operating and financial results, marking its first full quarter following the strategic combination with Veren that closed on May 12, 2025.…

ARC Resources: Lower 2026 Capex, Higher Volumes
ARC Resources used its third quarter update to reinforce a familiar message to Canadian E&P executives: disciplined capital, structurally better market access, and a growing shareholder return program…
North America News

Baytex 2026 Development Plans
Baytex’s 2026 development plan reflects a post–Eagle Ford sale capital program and a sharpened focus on its core Canadian assets. The Company approved 2026 exploration and development expenditures…

Tourmaline: 2026 Capital Program Locked In at $2.9B
Tourmaline’s 2026 exploration and production (EP) program is set at $2.9 billion and targets average production of 690,000–710,000 boepd, with the company maintaining the multi-year EP Plan released…

Advantage Plans $300–$330MM 2026 Capital Program
Advantage’s 2026 development plan centers on Glacier-focused drilling and key midstream work. The company plans total capital spending of $300 million to $330 million and expects production to…

Paramount Targets 42% Higher 2026 Capex, More Duvernay Wells
Paramount Resources is stepping up investment in 2026 as it advances the Willesden Green Duvernay (Central Alberta Region) buildout and launches major infrastructure at Sinclair (Montney). The company…

Birchcliff Targets Higher 2026 Output on Larger Capital Budget
Birchcliff’s updated 2025 plan targets higher production within a tightened capital range, supported by faster cycle times and lower costs. The company increased 2025 annual average production guidance…