

Plains All American Pipeline, today reported third-quarter 2020 results.
Summary Highlights
- Reported net income for the quarter of $143 million
- Delivered third-quarter 2020 Adjusted EBITDA of $682 million
- Completed the sale of LA Basin Terminals (closed October 15, 2020) for approximately $200 million (brings year-to-date asset sales proceeds to approximately $450 million)
- Increased full-year 2020 Adjusted EBITDA guidance to +/- $2.585 billion (increase of $85 million, or 3%)
- Provided preliminary estimate for 2021 Adjusted EBITDA of +/- $2.2 billion (assumes a $50 million contribution from the Supply & Logistics segment, and is net of the LA Basin Terminals sale and $600 million or more of additional asset sales targeted in 2021)
- Provided preliminary estimate for 2021 Free Cash Flow after distributions of roughly $300 million, or $900 million or more when including the benefit of proceeds from additional asset sales targeted in 2021
- Announced $500 million Common Equity Repurchase Program intended to be utilized as an additional method of returning capital to investors
“We delivered third-quarter results favorable to our expectations and raised our full-year 2020 guidance, which is now in-line with our beginning of the year pre-COVID expectations,” stated Willie Chiang, Chairman and CEO of Plains. “We have continued to execute across each of our key initiatives: operating safely and reliably, maximizing Free Cash Flow after distributions, reducing leverage, minimizing capital investment, optimizing our assets, streamlining our organization and reducing costs throughout the business.”
Mr. Chiang continued, “Our current equity valuation does not reflect the strength of our asset base or the long-term durability of our business, and we have reached an inflection point where we expect to generate meaningful levels of Free Cash Flow after distributions. Given the combination of these factors, today we announced a $500 million common equity repurchase program to be used as an additional method of returning capital to investors. In addition to reducing debt, we believe it is appropriate to allocate a portion of our Free Cash Flow after distributions to invest in our equity.”
|
Plains All American Pipeline |
||||||||||||||||||||||||||
|
Summary Financial Information (unaudited) |
||||||||||||||||||||||||||
|
(in millions, except per unit data) |
||||||||||||||||||||||||||
|
|
|
Three Months Ended |
|
% |
|
|
Nine Months Ended |
|
% |
|||||||||||||||||
|
GAAP Results |
|
2020 |
|
2019 |
|
Change |
|
|
2020 |
|
|
2019 |
|
Change |
||||||||||||
|
Net income/(loss) attributable to PAA (1) |
|
$ |
143 |
|
|
$ |
449 |
|
|
(68 |
) |
% |
|
|
$ |
(2,562 |
) |
|
|
$ |
1,865 |
|
|
(237 |
) |
% |
|
Diluted net income/(loss) per common unit |
|
$ |
0.13 |
|
|
$ |
0.55 |
|
|
(76 |
) |
% |
|
|
$ |
(3.72 |
) |
|
|
$ |
2.28 |
|
|
(263 |
) |
% |
|
Diluted weighted average common units outstanding (2) |
|
728 |
|
|
800 |
|
|
(9 |
) |
% |
|
|
728 |
|
|
|
800 |
|
|
(9 |
) |
% |
||||
|
Net cash provided by operating activities |
|
$ |
282 |
|
|
$ |
314 |
|
|
(10 |
) |
% |
|
|
$ |
1,256 |
|
|
|
$ |
1,778 |
|
|
(29 |
) |
% |
|
Distribution per common unit declared for the period |
|
$ |
0.18 |
|
|
$ |
0.36 |
|
|
(50 |
) |
% |
|
|
|
|
|
|
|
|||||||
| ____________________________________ | ||||
|
(1) |
Reported results for the nine months ended September 30, 2020 include aggregate non-cash goodwill and asset impairments and the write-down of certain of our investments in unconsolidated entities totaling $3.3 billion representing a nine-month net loss of $4.55 after tax per common unit. |
|||
|
(2) |
For the three and nine months ended September 30, 2019, includes all potentially dilutive securities (our Series A preferred units and equity-indexed compensation awards) outstanding during the period. See the “Computation of Basic and Diluted Net Income/(Loss) Per Common Unit” table attached hereto for additional information. |
|||
|
|
|
Three Months Ended |
|
% |
|
|
Nine Months Ended |
|
% |
||||||||||||||
|
Non-GAAP Results (1) |
|
2020 |
|
2019 |
|
Change |
|
|
2020 |
|
2019 |
|
Change |
||||||||||
|
Adjusted net income attributable to PAA |
|
$ |
382 |
|
|
$ |
430 |
|
|
(11) |
% |
|
|
$ |
1,070 |
|
|
$ |
1,546 |
|
|
(31) |
% |
|
Diluted adjusted net income per common unit |
|
$ |
0.46 |
|
|
$ |
0.52 |
|
|
(12) |
% |
|
|
$ |
1.26 |
|
|
$ |
1.88 |
|
|
(33) |
% |
|
Adjusted EBITDA |
|
$ |
682 |
|
|
$ |
731 |
|
|
(7) |
% |
|
|
$ |
2,001 |
|
|
$ |
2,377 |
|
|
(16) |
% |
|
Implied DCF per common unit and common equivalent unit |
|
$ |
0.63 |
|
|
$ |
0.63 |
|
|
— |
% |
|
|
$ |
1.84 |
|
|
$ |
2.21 |
|
|
(17) |
% |
|
Free cash flow |
|
$ |
73 |
|
|
$ |
(79) |
|
|
** |
|
|
$ |
195 |
|
|
$ |
535 |
|
|
** |
||
|
Free cash flow after distributions |
|
$ |
(95) |
|
|
$ |
(378) |
|
|
** |
|
|
$ |
(466) |
|
|
$ |
(343) |
|
|
** |
||
| ____________________________________ | ||
|
** |
Indicates that variance as a percentage is not meaningful. |
|
|
(1) |
See the section of this release entitled “Non-GAAP Financial Measures and Selected Items Impacting Comparability” and the tables attached hereto for information regarding certain selected items that PAA believes impact comparability of financial results between reporting periods, as well as for information regarding non-GAAP financial measures (such as Adjusted EBITDA, Implied DCF, Free Cash Flow and Free Cash Flow After Distributions) and their reconciliation to the most directly comparable measures as reported in accordance with GAAP. |
|
Segment Adjusted EBITDA for the third quarter and first nine months of 2020 and 2019 is presented below:
|
Summary of Selected Financial Data by Segment (unaudited) |
||||||||||||
|
(in millions) |
||||||||||||
|
|
Segment Adjusted EBITDA |
|||||||||||
|
|
Transportation |
|
Facilities |
|
Supply and |
|||||||
|
Three Months Ended September 30, 2020 |
$ |
444 |
|
|
$ |
176 |
|
|
$ |
61 |
|
|
|
Three Months Ended September 30, 2019 |
$ |
462 |
|
|
$ |
173 |
|
|
$ |
92 |
|
|
|
Percentage change in Segment Adjusted EBITDA versus 2019 period |
(4) |
% |
|
2 |
% |
|
(34) |
% |
||||
|
|
|
|
|
|
|
|||||||
|
|
Segment Adjusted EBITDA |
|||||||||||
|
|
Transportation |
|
Facilities |
|
Supply and |
|||||||
|
Nine Months Ended September 30, 2020 |
$ |
1,233 |
|
|
$ |
560 |
|
|
$ |
205 |
|
|
|
Nine Months Ended September 30, 2019 |
$ |
1,271 |
|
|
$ |
529 |
|
|
$ |
571 |
|
|
|
Percentage change in Segment Adjusted EBITDA versus 2019 period |
(3) |
% |
|
6 |
% |
|
(64) |
% |
||||
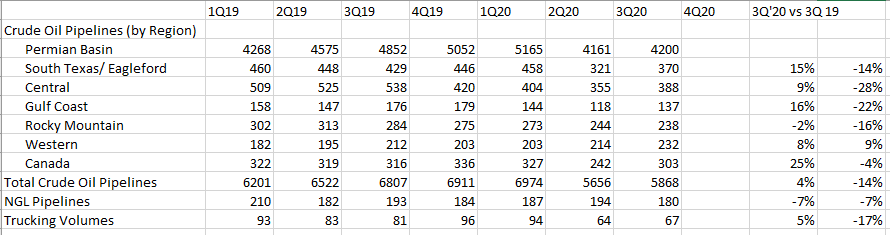
Third-quarter 2020 Transportation Segment Adjusted EBITDA decreased 4% versus comparable 2019 results due to reductions in tariff volumes in multiple regions resulting from lower crude oil prices, reduced drilling and completion activity and compressed regional basis differentials, partially offset by the benefit of minimum volume commitment deficiency payments associated with second quarter deficiencies.
Third-quarter 2020 Facilities Segment Adjusted EBITDA increased 2% versus comparable 2019 results primarily due to operational cost savings, increased spot activity at certain of our West Coast crude oil storage terminals and increased capacity at certain of our Mid-Continent and Gulf Coast crude oil storage terminals, partially offset by decreased activity at certain of our rail terminals resulting from less favorable market conditions and the impact of asset sales.
Third-quarter 2020 Supply and Logistics Segment Adjusted EBITDA decreased 34% versus comparable 2019 results due to less favorable crude oil differentials in both the Permian Basin and Canada, partially offset by the benefit of contango-based margin opportunities.
2020 Full-Year Guidance
The table below presents our full-year 2020 financial and operating guidance:
|
Financial and Operating Guidance (unaudited) |
||||||||||||
|
(in millions, except volumes, per unit and per barrel data) |
||||||||||||
|
|
Twelve Months Ended December 31, |
|||||||||||
|
|
2018 |
|
2019 |
|
2020 (G) |
|||||||
|
|
|
|
|
|
+ / - |
|||||||
|
Segment Adjusted EBITDA |
|
|
|
|
|
|||||||
|
Transportation |
$ |
1,508 |
|
|
$ |
1,722 |
|
|
$ |
1,620 |
|
|
|
Facilities |
711 |
|
|
705 |
|
|
715 |
|
||||
|
Fee-Based |
$ |
2,219 |
|
|
$ |
2,427 |
|
|
$ |
2,335 |
|
|
|
Supply and Logistics |
462 |
|
|
803 |
|
|
250 |
|
||||
|
Adjusted other income/(expense), net |
3 |
|
|
7 |
|
|
— |
|
||||
|
Adjusted EBITDA (1) |
$ |
2,684 |
|
|
$ |
3,237 |
|
|
$ |
2,585 |
|
|
|
Interest expense, net of certain non-cash items (2) |
(419) |
|
|
(407) |
|
|
(415) |
|
||||
|
Maintenance capital |
(252) |
|
|
(287) |
|
|
(215) |
|
||||
|
Current income tax expense |
(66) |
|
|
(112) |
|
|
(50) |
|
||||
|
Other |
1 |
|
|
(55) |
|
|
20 |
|
||||
|
Implied DCF (1) |
$ |
1,948 |
|
|
$ |
2,376 |
|
|
$ |
1,925 |
|
|
|
Preferred unit distributions paid (3) |
(161) |
|
|
(198) |
|
|
(200) |
|
||||
|
Implied DCF Available to Common Unitholders |
$ |
1,787 |
|
|
$ |
2,178 |
|
|
$ |
1,725 |
|
|
|
|
|
|
|
|
|
|||||||
|
Implied DCF per Common Unit and Common Equivalent Unit (1) |
$ |
2.38 |
|
|
$ |
2.91 |
|
|
$ |
2.35 |
|
|
|
|
|
|
|
|
|
|||||||
|
Distributions per Common Unit (4) |
$ |
1.20 |
|
|
$ |
1.38 |
|
|
$ |
0.90 |
|
|
|
Common Unit Distribution Coverage Ratio |
2.05 |
x |
|
2.17 |
x |
|
2.63 |
x | ||||
|
|
|
|
|
|
|
|||||||
|
Diluted Adjusted Net Income per Common Unit (1) |
$ |
1.88 |
|
|
$ |
2.51 |
|
|
$ |
1.59 |
|
|
|
|
|
|
|
|
|
|||||||
|
Operating Data |
|
|
|
|
|
|||||||
|
Transportation |
|
|
|
|
|
|||||||
|
Average daily volumes (MBbls/d) |
5,889 |
|
|
6,893 |
|
|
6,380 |
|
||||
|
Segment Adjusted EBITDA per barrel |
$ |
0.70 |
|
|
$ |
0.68 |
|
|
$ |
0.69 |
|
|
|
|
|
|
|
|
|
|||||||
|
Facilities |
|
|
|
|
|
|||||||
|
Average capacity (MMBbls/Mo) |
124 |
|
|
125 |
|
|
124 |
|
||||
|
Segment Adjusted EBITDA per barrel |
$ |
0.48 |
|
|
$ |
0.47 |
|
|
$ |
0.48 |
|
|
|
|
|
|
|
|
|
|||||||
|
Supply and Logistics |
|
|
|
|
|
|||||||
|
Average daily volumes (MBbls/d) |
1,309 |
|
|
1,369 |
|
|
1,290 |
|
||||
|
Segment Adjusted EBITDA per barrel |
$ |
0.97 |
|
|
$ |
1.61 |
|
|
$ |
0.53 |
|
|
|
|
|
|
|
|
|
|||||||
|
Investment Capital |
$ |
1,888 |
|
|
$ |
1,340 |
|
|
$ |
950 |
|
|
|
Fourth-Quarter Adjusted EBITDA as Percentage of Full Year |
35 |
% |
27 |
% |
23 |
% |
||||||
| ____________________________________ | |||
|
(G) |
2020 Guidance forecasts are intended to be + / - amounts. |
||
|
(1) |
See the section of this release entitled “Non-GAAP Financial Measures and Selected Items Impacting Comparability” and the Non-GAAP Reconciliation tables attached hereto for information regarding non-GAAP financial measures and, for the historical 2018 and 2019 periods, their reconciliation to the most directly comparable measures as reported in accordance with GAAP. We do not provide a reconciliation of non-GAAP financial measures to the equivalent GAAP financial measures on a forward-looking basis as it is impractical to forecast certain items that we have defined as “Selected Items Impacting Comparability” without unreasonable effort, due to the uncertainty and inherent difficulty of predicting the occurrence and financial impact of and the periods in which such items may be recognized. Thus, a reconciliation of non-GAAP financial measures to the equivalent GAAP financial measures could result in disclosure that could be imprecise or potentially misleading. |
||
|
(2) |
Excludes certain non-cash items impacting interest expense such as amortization of debt issuance costs and terminated interest rate swaps. |
||
|
(3) |
Cash distributions paid to our preferred unitholders during the year presented. Distributions on our Series A preferred units were paid-in-kind for the February 2018 quarterly distribution. Distributions on our Series A preferred units have been paid in cash since the May 2018 quarterly distribution. Distributions on our Series B preferred units are payable in cash semi-annually in arrears on May 15 and November 15. |
||
|
(4) |
Cash distributions per common unit paid during 2018 and 2019. 2020 (G) reflects the annualized distribution rate of $1.44 per common unit paid in February and the decreased annualized distribution rate of $0.72 per common unit for the remainder of the year. |
||
Plains GP Holdings
PAGP owns an indirect non-economic controlling interest in PAA’s general partner and an indirect limited partner interest in PAA. As the control entity of PAA, PAGP consolidates PAA’s results into its financial statements, which is reflected in the condensed consolidating balance sheet and income statement tables included at the end of this release. Information regarding PAGP’s distributions is reflected below:
|
|
Q3 2020 |
|
Q2 2020 |
|
Q3 2019 |
|||||||
|
Distribution per Class A share declared for the period |
$ |
0.18 |
|
|
$ |
0.18 |
|
|
$ |
0.36 |
|
|
|
Q3 2020 distribution percentage change from prior periods |
|
|
— |
% |
|
(50) |
% |
|||||
Related Categories :
Third Quarter (3Q) Update
More Third Quarter (3Q) Update News
-
Keystone Runs Steady as Blackrod Gas Link Nears Startup
-
Evolution Petroleum Corporation Fiscal Third Quarter 2023 Results
-
Civitas Resources Third Quarter 2022 Results
-
Murphy Oil Third Quarter 2022 Results
-
ConocoPhillips Third Quarter 2022 Results
Gulf Coast News >>>
-
Why $90 Oil Isn’t Bringing Back the Rigs -


-
These Three Companies Will Increase Drilling & Completion Over The Next 3 Year -

-
Q1 A&D Transactions Jump to $30B , While Deal Flow Was Down 40%

-
Wright to U.S. Oil Industry: The Price Signal Is Telling You to Drill

-
Apa Corp : Doing More With Less

Permian News >>>
-
Permian Resources to Grow Production 6% in 2026

-
Battalion Oil Closes ~$60M West Quito Draw Asset Sale

-
Deal Rumor: ConocoPhillips Exploring $2B Permian Asset Sale

-
An Eagle Ford Team That Cashed Out Is Back for Another Cycle -

-
Silver Hill Expands South Texas Footprint with Acquisition of 1776 Energy Assets
