
Drilling & Completions | Top Story | Quarterly / Earnings Reports | Third Quarter (3Q) Update | Capital Markets | Capital Expenditure | Drilling Activity | Capex Decrease | Capital Expenditure - 2019
Range Reduces Capital Budget; Well Count Unchanged

Range Resources has announced its third quarter 2019 financial results.
Shale Experts comments and observations:
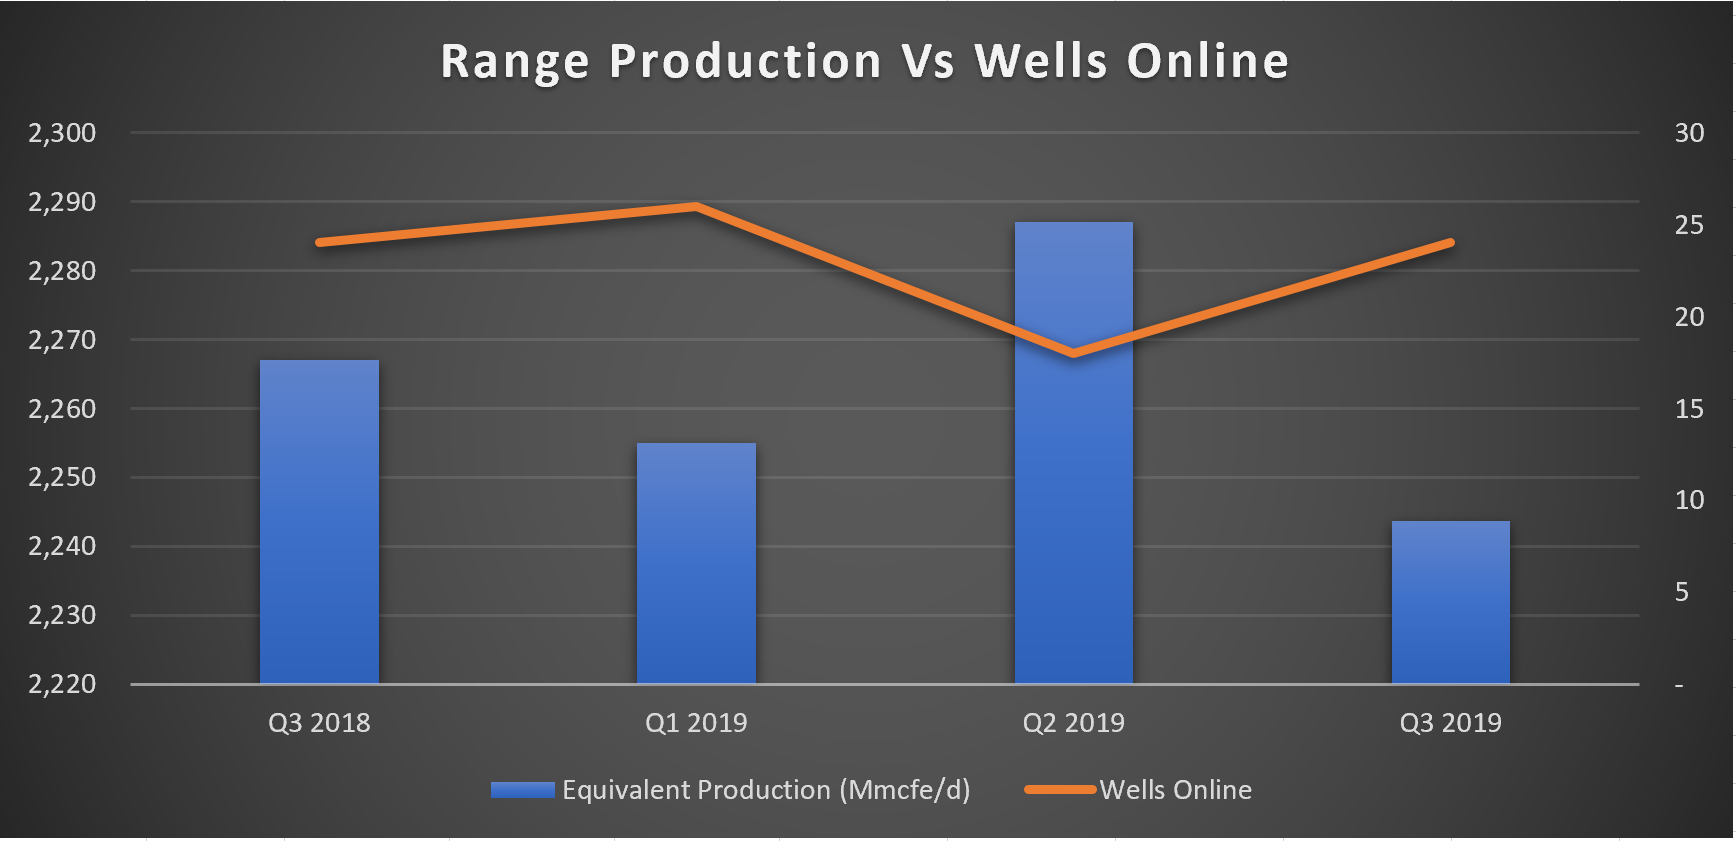
- Production was only down -2% sequentially -1% year over year. Basically you could say production was flat.
- Asset Sales totally $1.0 billion in the last 12 months
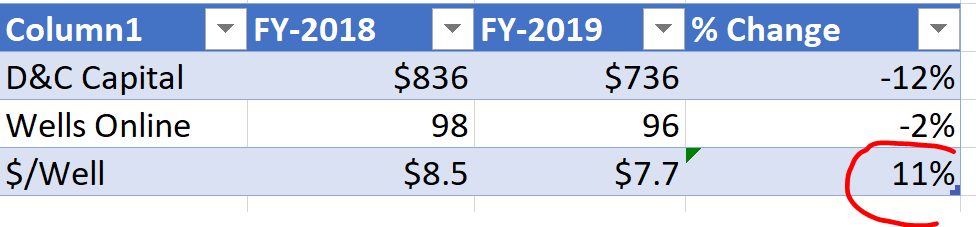
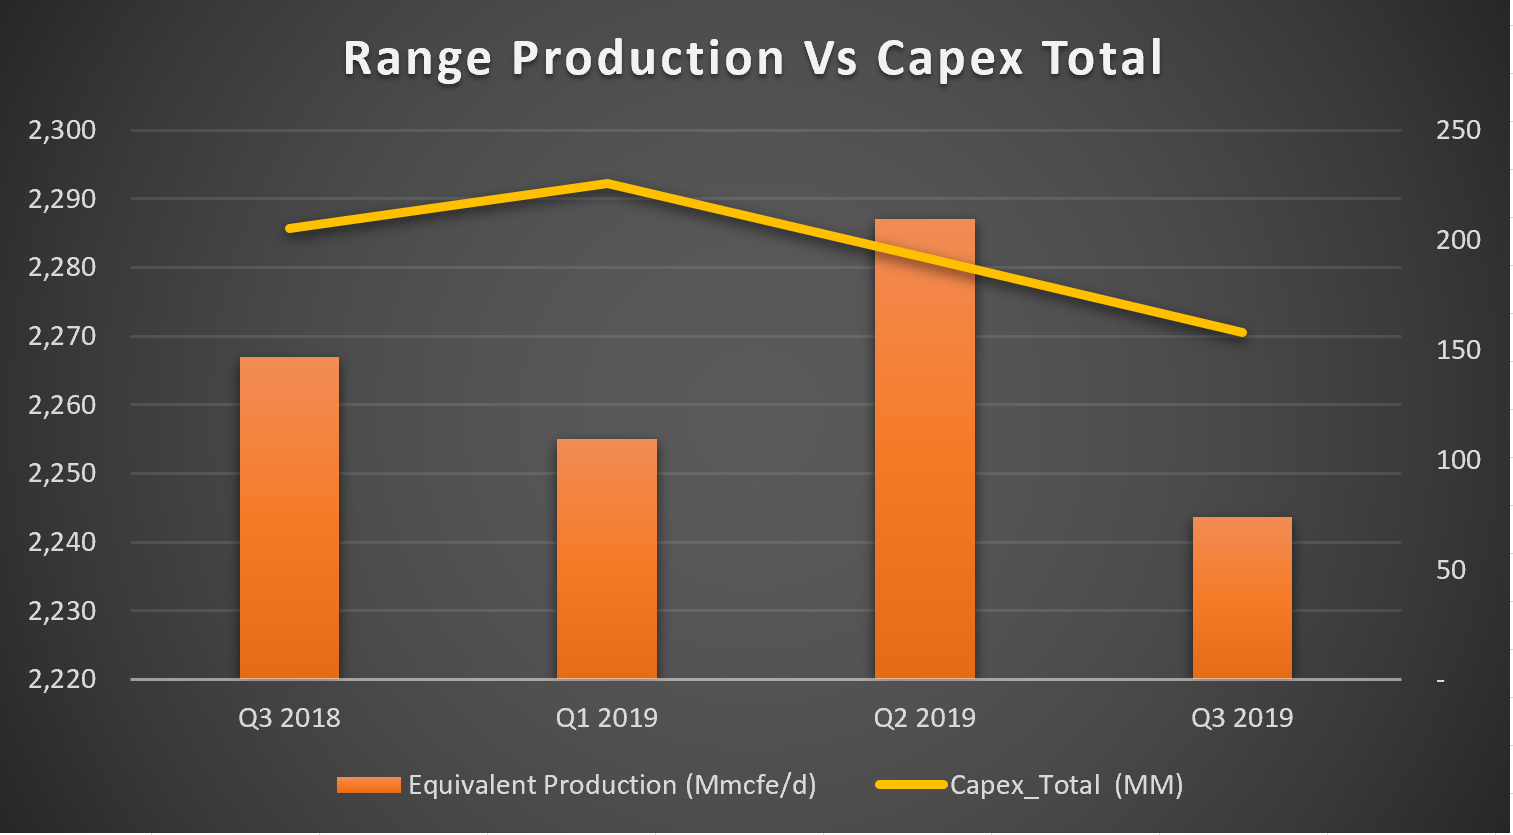
- Reduced Capital Budget by $20 million (new estimate is $736 million)
- Capital invested this quarter was $158 million, YTD is $576 million of the planned $736 million FY-2019 Guidance.
- Wells online YTD is 68 of the planned 96 wells.
Third Quarter 2019 Results
GAAP revenues for third quarter 2019 totaled $622 million, GAAP net cash provided from operating activities (including changes in working capital) was $104 million, and GAAP net income was a loss of $28 million ($0.11 per diluted share). Third quarter earnings results include a $75 million derivative gain due to decreases in commodity prices and a $36 million loss related to asset sales.
Non-GAAP revenues for third quarter 2019 totaled $628 million, and cash flow from operations before changes in working capital, a non-GAAP measure, was $128 million. Adjusted net income comparable to analysts' estimates, a non-GAAP measure, was a loss of $18 million ($0.07 per diluted share) in third quarter 2019.
Capital Expenditures
Third quarter 2019 drilling and completion expenditures were $148 million. In addition, during the quarter, $9 million was spent on acreage purchases and $1 million on gathering facilities. Total capital expenditures year to date in 2019 were $576 million. Range is reducing its expected 2019 capital spending by $20 million to $736 million as a result of continued efficiency gains, water savings, and service cost improvements.
Operational Discussion
NGL Marketing
During September and October, Sunoco performed optimization work at the Marcus Hook export terminal which is expected to result in more efficient transportation to end markets. The upgrade required the Mariner East pipeline to experience downtime, and as a result of the outage, Range sold ethane volumes in its residue natural gas stream that would typically be transported via the Mariner East system.
The value of exported barrels from the East Coast increased during the quarter, particularly in September after a Middle East oil disruption. Range capitalized on the opportunity during the third quarter by utilizing both pipeline and rail access to export terminals. Propane export values at the dock remain elevated and are currently estimated at $0.10 per gallon above the Mont Belvieu index. The combination of ethane rejection and access to international markets for propane and butane led to the best quarterly NGL differential to Mont Belvieu that Range has realized in recent history. Range resumed use of Mariner East ethane capacity in mid-October and expects another strong differential to Mont Belvieu in the fourth quarter of 2019.
Appalachia Division
Production for third quarter 2019 averaged approximately 2,042 net Mmcfe per day from the Appalachia division, a 3% increase over the prior-year third quarter. Despite the third-party optimization work mentioned above, which impacted ethane recovery, the southwest area of the division averaged 1,945 net Mmcfe per day during third quarter 2019. The northeast Marcellus properties averaged 97 net Mmcf per day inclusive of approximately 15 net Mmcf per day of legacy acreage production during third quarter 2019.
North Louisiana
Production for third quarter 2019 averaged approximately 202 net Mmcfe per day. The division brought on line two wells during the quarter and expects to bring on line an additional well during the fourth quarter.
The table below summarizes estimated activity for 2019 regarding the number of wells to sales for each area.
| Wells TIL 3Q 2019 |
Wells TIL 1H 2019 |
Calendar 2019 Planned TIL |
Remaining 4Q 2019 |
|||||
| SW PA Super-Rich | 8 | 11 | 19 | 0 | ||||
| SW PA Wet | 8 | 8 | 36 | 20 | ||||
| SW PA Dry | 6 | 20 | 33 | 7 | ||||
| Total Appalachia | 22 | 39 | 88 | 27 | ||||
| Total N. LA. | 2 | 5 | 8 | 1 | ||||
| Total | 24 | 44 | 96 | 28 | ||||
Guidance 2019
Production per day Guidance
Production for fourth quarter 2019 is expected to be ~2.33 to 2.35 Bcfe per day, which includes an approximately 25 Mmcfe per day impact from recent asset sales and ethane recovery. Full year 2019 production is expected to average ~2.28 Bcfe per day, which is in line with prior guidance, after incorporating asset sales and reduced ethane recovery in September and October.
4Q 2019 Expense Guidance
| Direct operating expense: | $0.16 $0.17 per mcfe | |
| Transportation, gathering, processing and compression expense: | $1.40 $1.42 per mcfe | |
| Production tax expense: | $0.04 $0.05 per mcfe | |
| Exploration expense: | $7.0 $9.0 million | |
| Unproved property impairment expense: | $15.0 $18.0 million | |
| G&A expense: | $0.15 $0.17 per mcfe | |
| Interest expense: | $0.19 $0.21 per mcfe | |
| DD&A expense: | $0.67 $0.70 per mcfe | |
| Net brokered gas marketing expense: | ~$6.0 million |
Price Guidance
Based on current market indications, Range expects to average the following pre-hedge differentials for fourth quarter 2019 production.
| 4Q 2019 Pricing Guidance | |
| Natural Gas: (1) | NYMEX minus $0.30 |
| Natural Gas Liquids: (2) | Mont Belvieu minus $0.60 to $0.80 per barrel |
| Oil/Condensate: | WTI minus $6.00 to $8.00 |
(1) Including basis hedging
(2) Weighting based on 53% ethane, 27% propane, 7% normal butane, 4% iso-butane and 9% natural gasoline.
Asset Sales and Bank Credit Facility
During the quarter, Range sold 2.5% proportionately reduced overriding royalty interests in 350,000 net surface acres in southwest Appalachia for gross proceeds totaling $750 million. The royalty sales were effective as of March 1, 2019, and apply to existing and future Marcellus, Utica and Upper Devonian development on the subject leases. Sale processes to monetize additional non-core assets remain underway.
Separately during the third quarter, Range divested of certain legacy dry gas assets in Appalachia that were producing approximately 3 Mmcfe per day. The divestiture is modestly accretive to cash flow. Range maintains the rights to develop deeper horizons including Marcellus, Utica and Upper Devonian.
In October, the Company increased its credit facility commitment from $2.0 billion to $2.4 billion.
Repurchase Programs
Range repurchased and retired approximately $94 million in principal amount of its senior notes during the quarter for a total cash spend of approximately $90 million.
Range's Board of Directors approved the initiation of a $100 million equity repurchase program, beginning October 2019. The share repurchase program will be executed at times deemed appropriate by the Company.
Third Quarter Unit Costs and Realized Pricing
The following table details Range's unit cost trend since year-end 2018 (a):
| Expenses | 3Q 2019 ($/Mcfe) |
2Q 2019 ($/Mcfe) |
1Q 2019 ($/Mcfe) |
4Q 2018 ($/Mcfe) |
|||||||
| Direct operating(a) | $ | 0.17 | $ | 0.16 | $ | 0.16 | $ | 0.18 | |||
| Transportation, gathering, processing and compression | 1.43 | 1.45 | 1.49 | 1.51 | |||||||
| Production and ad valorem taxes | 0.04 | 0.05 | 0.06 | 0.08 | |||||||
| General and administrative(a) | 0.16 | 0.18 | 0.18 | 0.16 | |||||||
| Interest expense(a) | 0.22 | 0.24 | 0.25 | 0.25 | |||||||
| Total cash unit costs(b) | 2.02 | 2.08 | 2.13 | 2.18 | |||||||
| Depletion, depreciation and amortization (DD&A) | 0.67 | 0.68 | 0.68 | 0.75 | |||||||
| Total cash unit costs plus DD&A(b) | $ | 2.68 | $ | 2.76 | $ | 2.82 | $ | 2.93 | |||
| (a) Excludes stock-based compensation, legal settlements, rig release penalties, termination costs and amortization of deferred financing costs. | |||||||||||
| (b) May not add due to rounding. | |||||||||||
Third quarter 2019 cash unit costs totaled $2.02 per mcfe, an improvement of $0.16 per mcfe compared to fourth quarter 2018. This improvement was primarily driven by lower transportation, gathering, processing and compression (GP&T), interest and production tax expenses per mcfe. Range expects an additional 2% reduction in cash unit costs during fourth quarter 2019, primarily driven by additional improvements in GP&T and interest expense per mcfe. Range anticipates further unit cost improvement in 2020 and beyond to be driven by lower GP&T, interest, and cash G&A per mcfe.
The following table details Range's average production and realized pricing for third quarter 2019:
| Net Production | |||||||
| Natural Gas (Mmcf/d) |
Oil (Bbl/d) | NGLs (Bbl/d) |
Natural Gas Equivalent (Mmcfe/d) |
||||
| 1,562 | 10,212 | 103,383 | 2,244 | ||||
| Realized Pricing (a) | ||||||||
| Natural Gas ($/Mcf) |
Oil ($/Bbl) |
NGLs ($/Bbl) |
Natural Gas Equivalent ($/Mcfe) |
|||||
| Average NYMEX price | $2.23 | $56.42 | ||||||
| Differential, including basis hedging | (0.26) | (6.84) | ||||||
| Realized prices before NYMEX hedges | 1.97 | 49.58 | $15.06 | $2.30 | ||||
| Settled NYMEX hedges | 0.51 | 0.15 | 0.74 | 0.38 | ||||
| Average realized prices after hedges | $2.48 | $49.73 | $15.80 | $2.69 | ||||
| (a) May not add due to rounding | ||||||||
Third quarter 2019 natural gas, NGLs and oil price realizations (including the impact of derivative settlements which correspond to analysts' estimates) averaged $2.68 per mcfe. Additional detail on commodity price realizations can be found in the Supplemental Tables provided on the Company's website.
- The average natural gas price, including the impact of basis hedging, was $1.97 per mcf, or $0.26 per mcf below NYMEX. Based on recent pricing, Range expects a fourth quarter 2019 differential of approximately $0.30 below NYMEX.
- Pre-hedge NGL realizations were $15.06 per barrel, or $0.29 per barrel below to a Mont Belvieu weighted barrel, as shown on Supplemental Table 9 on the Company's website. The third quarter NGL differential to Mont Belvieu was the best in recent Company history. Range expects to maintain a strong differential during fourth quarter 2019 as a result of access to international markets and its diversified portfolio of ethane contracts.
- Crude oil and condensate price realizations, before realized hedges, averaged $49.58 per barrel, or $6.84 below West Texas Intermediate (WTI). Range expects a fourth quarter 2019 oil and condensate pricing differential of approximately $7 below WTI.
Related Categories :
Third Quarter (3Q) Update
More Third Quarter (3Q) Update News
-
Keystone Runs Steady as Blackrod Gas Link Nears Startup
-
Evolution Petroleum Corporation Fiscal Third Quarter 2023 Results
-
Civitas Resources Third Quarter 2022 Results
-
Murphy Oil Third Quarter 2022 Results
-
ConocoPhillips Third Quarter 2022 Results
Northeast News >>>
-
Why $90 Oil Isn’t Bringing Back the Rigs -


-
Q1 A&D Transactions Jump to $30B , While Deal Flow Was Down 40%

-
Ascent Resources 2026: A Quiet Growth Story for Oilfield Services

-
Infinity Closes $1.2B Utica Upstream & Midstream Deal

-
Antero Resources Completes $2.8B Marcellus Expansion

Northeast - Appalachia News >>>
-
A Quiet Capital Pattern Is Forming in North American Upstream — and Almost No One Is Talking About It -

-
Ascent is quietly setting the Utica productivity curve

-
Kimmeridge Offers $6 Billion for Ascent Resources: A Bid Lands in the Middle of a High-Stakes Sponsor Dispute

-
Dallas Fed Energy Survey: What Oil and Gas Executives Are Really Saying

-
Infinity and NOG Buy Antero's Ohio Utica Assets for $1.2B: A Vertical-Integration Utica Power Move
